
The tensile test applies an axial tensile force to a standardized test specimen, increasing it at a controlled rate until fracture. The machine records force and elongation, and from them come the yield strength, the tensile strength (Rm = Fm / S0), the modulus of elasticity, the elongation and the reduction of area. For metals, the test follows ISO 6892-1:2024 (ABNT NBR ISO 6892-1 in Brazil) or ASTM E8/E8M-25. For plastics, it follows ASTM D638-22 or ISO 527-2.
30-second summary:
- How it is calculated: stress = force ÷ original cross-sectional area (σ = F / S0, in MPa); strain = elongation ÷ original length (ε = ΔL / L0).
- What it measures: yield (Rp0.2), tensile strength (Rm), modulus (E), elongation (A) and reduction of area (Z).
- What it is done with: a universal testing machine (UTM), fitted with a load cell and an extensometer.
- It is destructive: the specimen breaks, so it is taken from a sample that represents the lot.
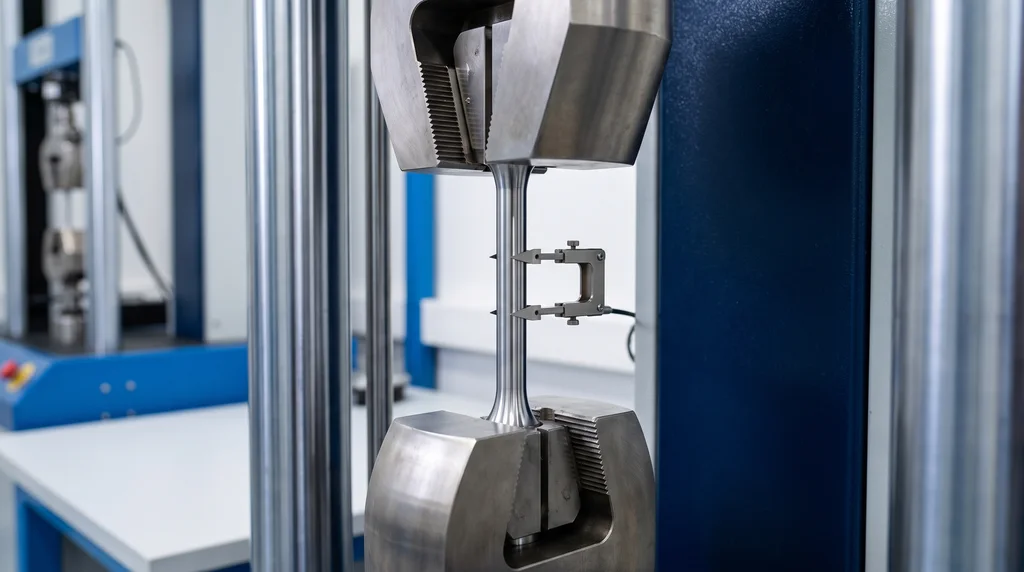
The photo shows a steel test specimen set up for the test. It is held between the wedge grips, and the extensometer is attached to the gauge section to measure elongation.
What the tensile test is and what it measures
ISO 6892-1 defines the test as straining a test specimen by tensile force, usually to fracture, to determine mechanical properties. It is the most widely used mechanical test. It is fast and reproducible, and a single curve gives the material's stiffness, strength and ductility. It is used to accept steel lots, develop alloys and polymers, qualify composites and supply data for design calculations. It belongs to the family of mechanical tests and measures many of the mechanical properties of materials.
The test can be run on a standardized specimen or on the actual part. A specimen gives the properties of the material, which can be compared across suppliers and lots. Testing the whole part, such as a bolt, a cable or a bar, shows how that product behaves under service conditions.
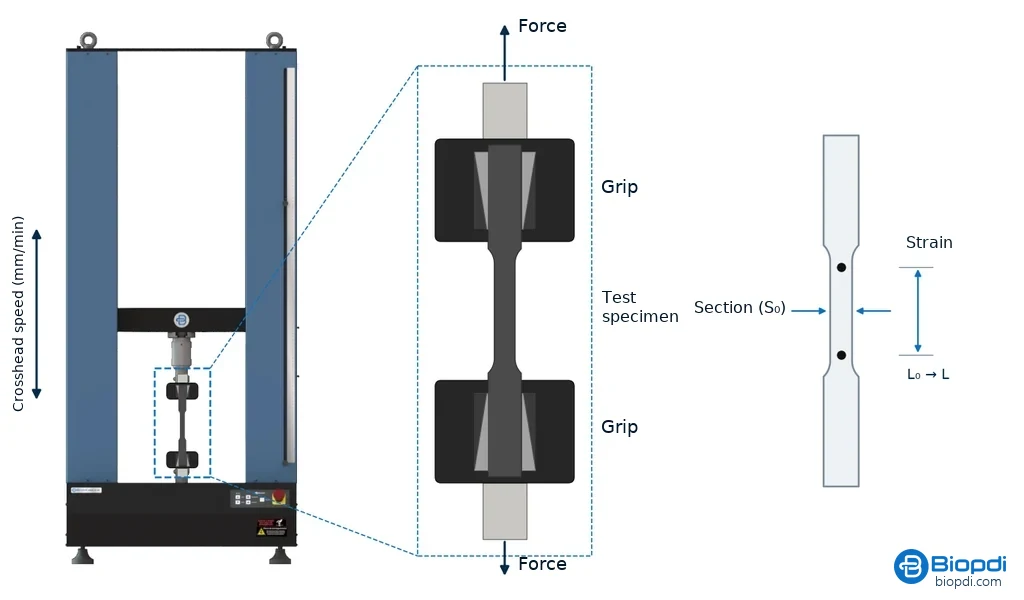
The diagram below shows the principle on a Biopdi dual-column universal testing machine. The crosshead moves at a controlled speed and pulls the grips apart while the load cell measures the force. The center shows an enlarged view of the wedge grips, which clamp the specimen harder as the force increases. On the right is the specimen: the reduced section, where stress is calculated, and the two gauge marks, whose separation gives the strain. Both quantities are defined in the test specimen section that follows.
| Property | Symbol (ISO) | What it tells you |
|---|---|---|
| Modulus of elasticity | E | stiffness: how much the material deforms reversibly per MPa applied |
| Proof strength (offset yield strength) | Rp0.2 | stress at which permanent deformation begins (0.2 % residual) |
| Upper and lower yield strength | ReH / ReL | in steels with a yield point plateau |
| Tensile strength | Rm | highest engineering stress the specimen withstands |
| Elongation after fracture | A | ductility measured over the gauge length |
| Total elongation at maximum force | Agt | required for reinforcing bars (rebar) |
| Reduction of area | Z | reduction of area at the fracture point |
Test specimens for the tensile test
The test specimen is what makes the test reproducible. The result depends on the length and shape of the specimen, the loading rate and the accuracy of the measurements. Standards therefore fix the dimensions, so two laboratories following the same standard get comparable values. The right shape depends on the material, the machine capacity and the product the sample is taken from. One requirement applies to all of them: the specimen must break within the gauge section, or the test is invalid.
Parts of the test specimen
Every tensile specimen has three regions, each with its own function:
- Gauge section (reduced section): the narrower central portion, with a known original cross-sectional area S0. This is where the material is actually tested. The gauge length L0, over which elongation is measured, is marked inside it.
- Grip ends: the ends held in the grips. Their cross section is larger than the gauge section, so stress there is lower and the specimen does not break there. Their shape depends on how the specimen is held: plain for wedge grips, threaded or shouldered.
- Fillet radius (R): the curve that joins each grip end to the gauge section. A sudden change in section would concentrate stress and make the specimen break at the transition. The radius spreads that change out.
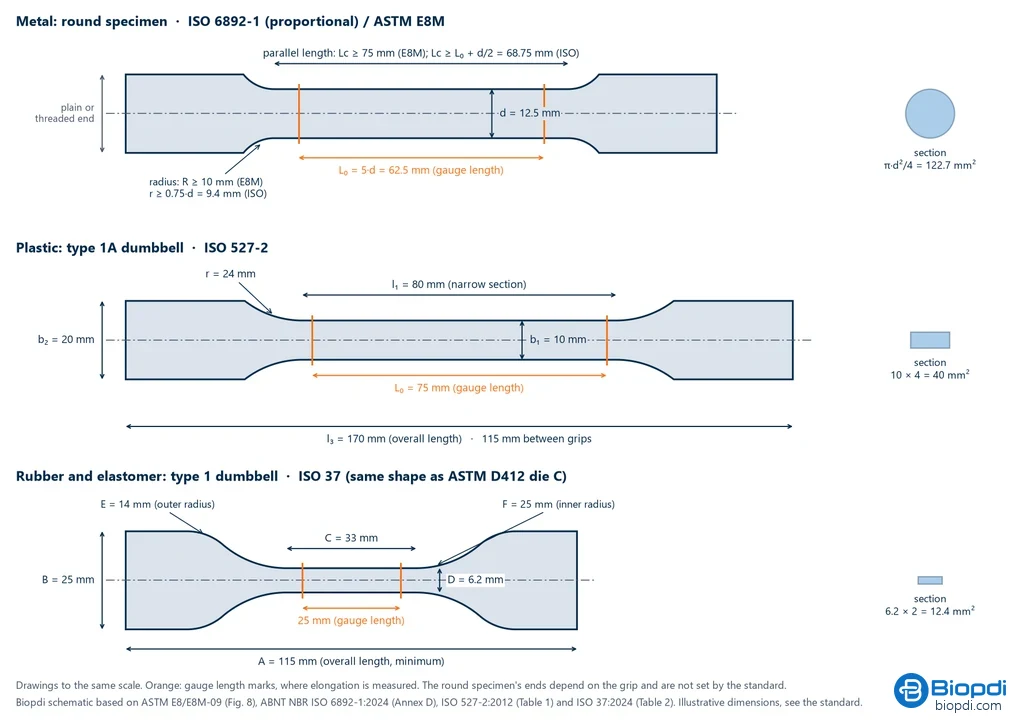
The diagram below shows these three regions on the most common shapes: the round metal specimen, the plastic dumbbell and the rubber dumbbell. The orange marks show the ends of the gauge length. On the round specimen, the minimum parallel length and radius depend on the standard: 75 mm and 10 mm in ASTM E8M, L0 + d/2 and 0.75·d in ISO 6892-1.
Why each material has its own shape
- Metal: machined specimens, round or flat. In ISO 6892-1 the gauge length is proportional to the cross section, L0 = 5.65·√S0 (5 times the diameter for a round specimen). This lets you compare the elongation of specimens of different sizes. ASTM E8 uses 4 diameters and E8M uses 5, so elongation can only be compared between tests with the same L0.
- Plastic: a flat dumbbell, injection molded or machined from a plaque. In ISO 527-2 type 1A, the narrow section measures 10 × 4 mm and is 80 mm long. The wider ends make sure the specimen breaks in the narrow section.
- Rubber and elastomers: the dumbbell is stamped from a 2 mm sheet with a cutting die. In ISO 37 type 1, the narrow section is short (33 mm) and the transition has two radii. Rubber stretches to several times its own length, so the test length is only 25 mm.
Round or rectangular section, and sampling direction
Specimens from castings and turned bars usually have a round cross section. Specimens cut from sheet and plate have a rectangular one. In rolled sheet the sampling direction matters, because properties differ between the rolling direction and the transverse direction (anisotropy), so the direction goes in the test report. Rebar, wire and cable are not machined. They are tested full-section, each with its own type of grip.
Dimensions by standard
The table summarizes the dimensions of the most common specimens in each standard:
| Standard and type | Gauge section | Gauge length |
|---|---|---|
| ISO 6892-1, proportional | any | 5.65√S0 (5d0 for round specimens), minimum 15 mm |
| ASTM E8, standard round (dimensions from E8/E8M-09) | d = 12.5 mm | 50 mm (4D) |
| ASTM E8M, round | d = 12.5 mm | 62.5 mm (5D) |
| ASTM E8, small-size round | d = 9 / 6 mm | 36 / 24 mm |
| ASTM E8, sheet-type | width 12.5 mm | 50 mm |
| ASTM E8, plate-type | width 40 mm | 200 mm |
| ASTM D638 type I (plastic) | width 13 mm, thickness up to 7 mm | 50 mm |
| ASTM D638 type V (limited material) | width 3.18 mm | 7.62 mm |
| ISO 527-2 type 1A (plastic) | 10 × 4 mm | 75 mm (l₃ = 170 mm) |
| ISO 37 type 1 (rubber; ASTM D412 die C) | 6.2 × 2.0 mm | 25 mm (A = 115 mm) |
Tensile test step by step
- Cut and machine the test specimen. Record where it was taken from and in which direction, since both go in the report. The surface must be free of notches and burrs.
- Measure S0. Use a micrometer and measure at more than one position and in more than one direction.
- Mark L0. Use fine marks that cannot start a crack. For a proportional specimen, L0 = 5.65√S0, with a minimum of 15 mm.
- Check the temperature. It must be between 10 and 35 °C, or 23 ± 5 °C when the test calls for controlled conditions.
- Zero the force and mount the specimen in the grips. Zero the load cell before you clamp the specimen. Use wedge grips for metals and align them carefully with the axis.
- Apply a small preload and attach the extensometer. The preload takes up slack in the load train without yielding the material.
- Pull at the rate the standard specifies. In ISO 6892-1 method A, use 0.00025 s⁻¹ (±20 %) until the yield strength has been determined, then 0.0067 s⁻¹ (±20 %) until fracture. These are the recommended values. The standard also allows 0.00007 s⁻¹ before yield and 0.00025 or 0.002 s⁻¹ after it. In ASTM E8 control method A, the stress rate in the elastic range is between 1.15 and 11.5 MPa/s (E8/E8M-09, the edition we consulted).
- Remove the extensometer, unless it is designed to stay on through fracture, after yield and before fracture.
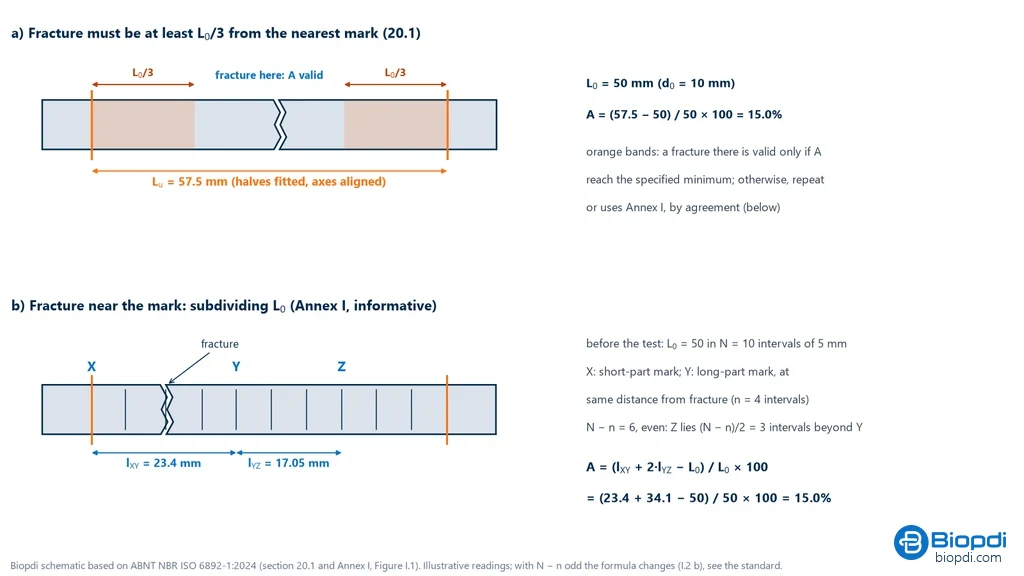
- Measure after fracture. Fit the broken halves together and measure Lu. Measure the minimum diameter to calculate Z. Elongation is valid only if the fracture is at least L0/3 from the nearest gauge mark, unless the result already meets the specified minimum.
- Calculate, round and issue the test report.
For a 10 mm specimen with a 60 mm parallel length, like the one in the worked example later on, the crosshead speed under method A2 would be about 0.9 mm/min up to yield and 24 mm/min after it.
Step 9 includes a validity rule, explained in the diagram below. The top part shows the fracture position. With the halves fitted together, Lu is measured, and the result is valid if the fracture is at least L0/3 from the nearest mark. Otherwise it is valid only if the elongation has already reached the minimum. The bottom part shows the method in Annex I of ISO 6892-1, used by agreement, which saves a specimen that broke near a mark. Before the test, L0 is divided into 5 mm intervals. A is then recalculated from marks X and Y, which are the same distance from the fracture, and a mark Z beyond Y. The formula appears in the diagram.
Stress-strain curve from the tensile test
During the test, the machine records force and elongation. The software divides the force by the original cross-sectional area S0 and the elongation by the gauge length L0, then plots the stress-strain curve. Every property of the test comes from this curve. The sections below cover the regions of the curve, what each property means and how the shape of the curve changes between ductile and brittle materials. For a detailed reading, see the article on the stress-strain curve.
The regions of the curve and points A, B, C and D
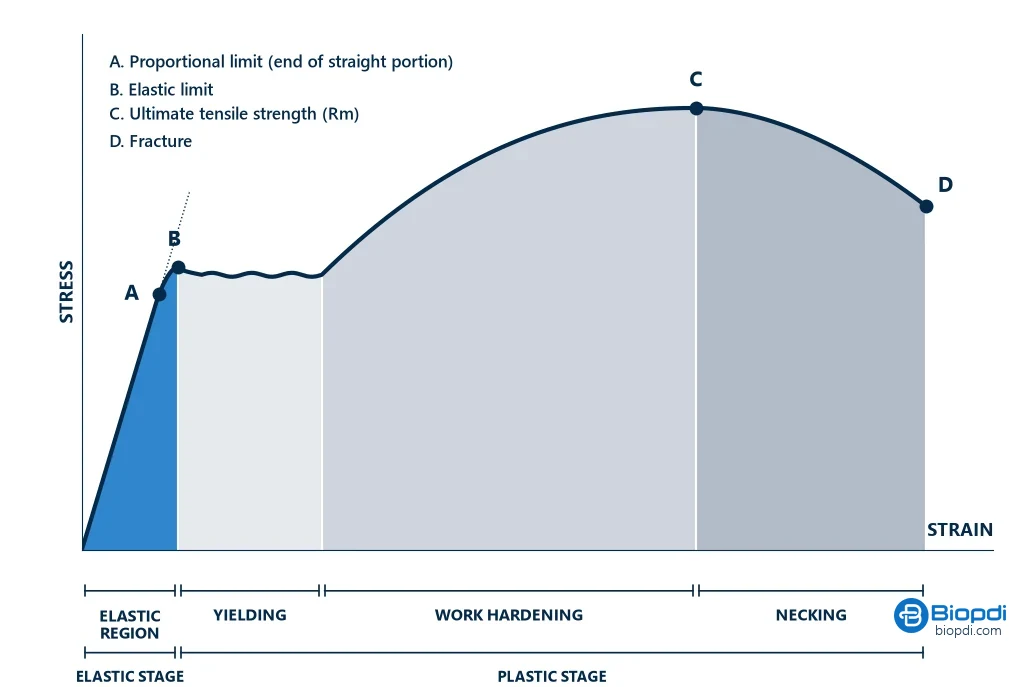
The curve of a ductile metal always passes through the same four regions: elastic, yielding, work hardening and necking. Four points mark the transitions between them. A is the proportional limit, where the curve stops being straight. B is the elastic limit, just above it. C is the ultimate tensile strength, and D is fracture. The graph below shows the regions and the points on a typical curve.
Reading the curve from left to right:
- Elastic region, up to points A and B. Stress and strain increase together along a straight line. If the load is removed in this portion, the test specimen returns to its original length. The slope of the line is the modulus of elasticity.
- A, the proportional limit, and B, the elastic limit. The proportional limit is the last stress at which the curve is still straight. The elastic limit is the highest stress the material can withstand without permanent deformation. In metals the two are so close that in practice they are treated as the same point, and both are hard to measure. For this reason, standards use the offset yield strength, Rp0.2, in their place.
- Yielding. Plastic deformation begins, and it is permanent. Low-carbon steels show a plateau in which the specimen elongates without any increase in force (ReH and ReL). In most metals the transition is gradual.
- Work hardening, up to point C. Plastic deformation hardens the metal, and the force rises again until it reaches its maximum. Point C is the ultimate tensile strength, Rm.
- Necking, from C to D. Deformation concentrates at one location, the cross-section thins into a neck and the force drops until fracture at point D. The engineering curve drops because it divides the force by the original area. In the thinning section, the true stress keeps rising.
What each property of the curve means
Modulus of elasticity (E). It is the ratio of stress to strain in the straight portion, E = σ / ε, and it measures stiffness: the higher it is, the less the material deforms under the same stress. In metals it depends on the bonds between atoms and hardly at all on the microstructure. That is why an annealed steel and a quenched steel have practically the same E, between 190 and 210 GPa. It is Hooke's law applied to the material.
Elastic deformation and plastic deformation. Elastic deformation is reversible and disappears when the load is removed. Beyond yielding, stress is no longer proportional to strain and part of the elongation becomes permanent. This is plastic deformation: it is what allows metal to be formed, and it gives warning before fracture.
Yield strength (Rp0.2, ReH, ReL). It is the stress at which permanent deformation begins, and it is the basis of structural design: parts are sized to work below it. When there is no plateau, the 0.2% offset method is used, as shown in "How to calculate" below.
Ultimate tensile strength (Rm). It is the highest engineering stress on the curve, Rm = Fm / S0. Necking begins after this point, and the part can no longer carry a higher load.
Ductility (A and Z). It is how much the material deforms plastically before fracture, measured by elongation after fracture (A) and reduction of area (Z). A material with little or no plastic deformation is brittle. Ductility shows how much a part will deform, giving warning, before it fractures, and how much forming it can take during manufacturing.
Toughness. It is the energy the material absorbs up to fracture, represented by the area under the whole curve, so it combines strength and ductility. It is desirable in parts subject to shock, such as gears and chains. Impact toughness, with a notch and high velocity, is measured in a different test, the Charpy impact test.
Resilience. It is the energy the material absorbs in the elastic portion and releases when unloaded, measured by the modulus of resilience Ur = σe² / (2E), the area under the straight portion. For a steel with a yield strength of 350 MPa and E of 205 GPa, the same as in the worked example below, Ur = 350² / (2 × 205,000) = 0.30 MJ/m³. Spring materials need a high yield strength and a low modulus.
Work hardening. It is the hardening of a metal caused by its own plastic deformation: dislocations multiply and become entangled, and more force is needed to continue deforming it. It is the rising portion between yielding and point C.
Necking. It is the formation of the neck, which happens when work hardening no longer compensates for the reduction in cross-section and deformation concentrates at one location. The reduction of area at fracture (Z) measures how much the section thinned.
Poisson's ratio (ν). When the test specimen elongates, it also gets thinner. Poisson's ratio is the ratio, taken as positive, of lateral strain to axial strain: ν = −εlateral / εaxial. In metals it is between 0.25 and 0.35, and the theoretical maximum is 0.5. Measuring it requires an axial extensometer and a transverse extensometer.
Ductile and brittle materials
Ductile materials, such as low-carbon steel, copper and most polymers, deform considerably in the plastic range and form a neck before fracture. Brittle materials, such as gray cast iron, quenched steel and ceramics, undergo almost no plastic deformation and break suddenly. The shape of the curve also depends on composition, heat treatment, prior deformation of the material, test speed and temperature.
The shape of the curve also indicates the type of fracture. Ductile fracture, with a cup-and-cone surface, comes with necking and a high Z. Brittle fracture is flat and perpendicular to the axis, with no necking. See the difference in ductility.
The three graphs below compare metals that behave differently: low-carbon steel, ductile and with a yield plateau; copper, ductile and without a plateau; and gray cast iron, which breaks with almost no plastic deformation.
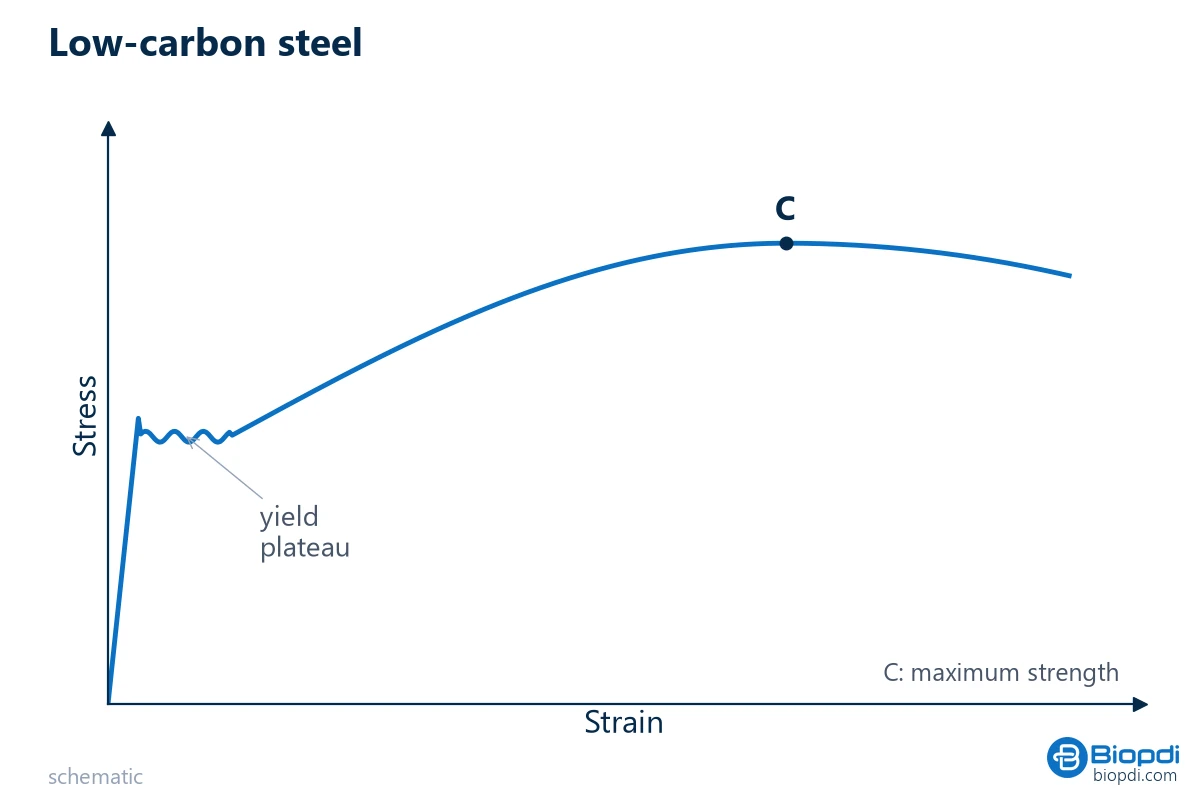
Low-carbon steel
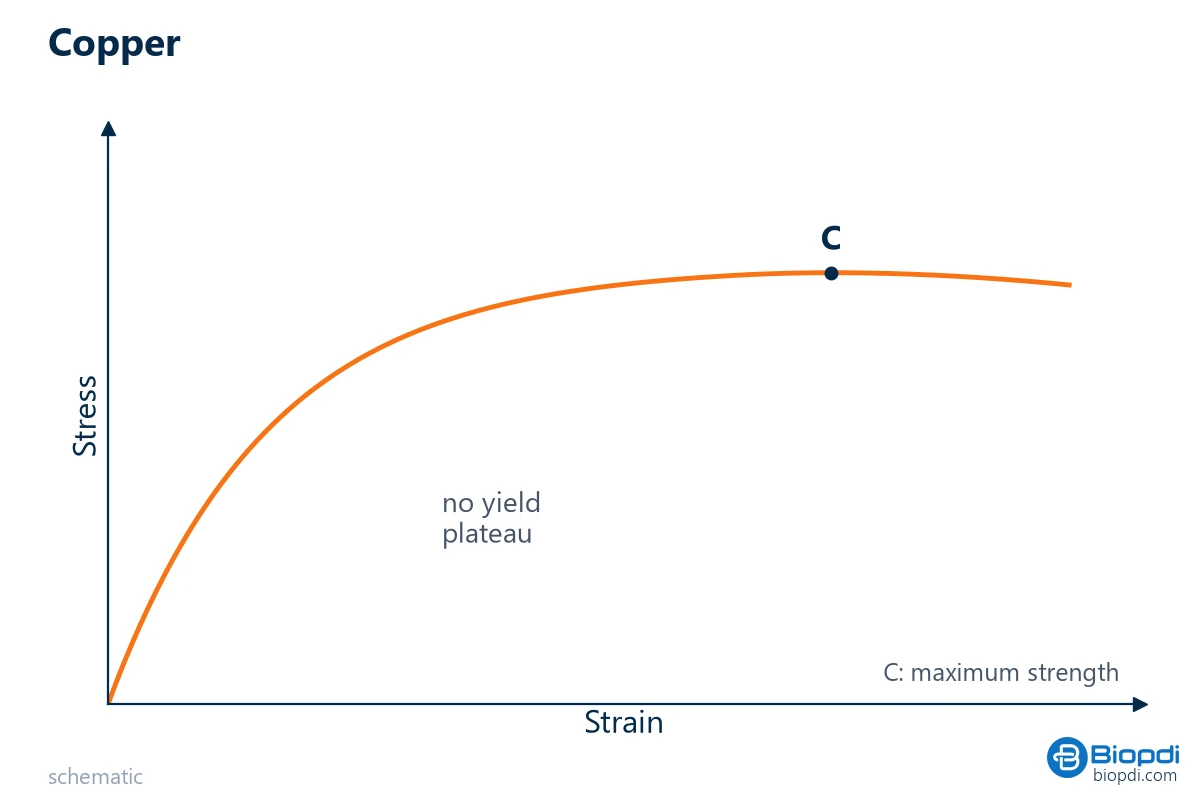
Copper
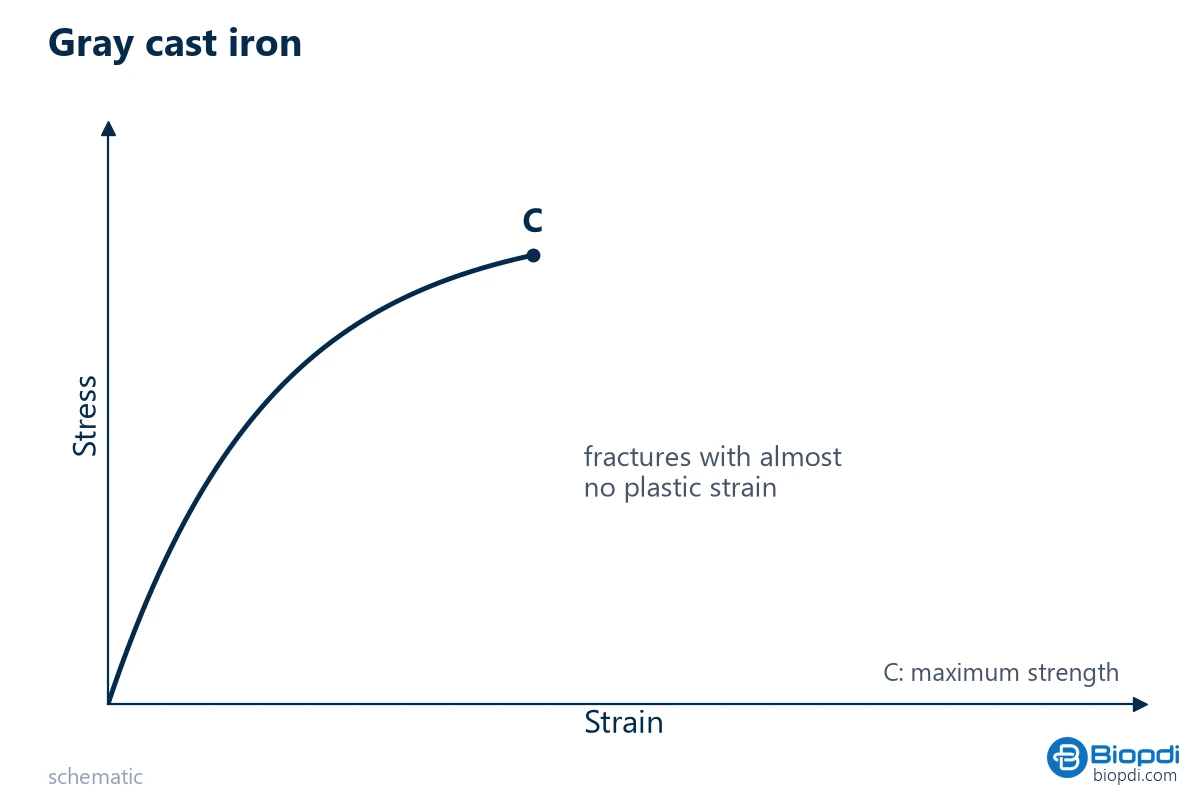
Gray cast iron
How to calculate: tensile test formulas
The whole test comes down to dividing force by area and elongation by length. The notation below follows ISO 6892-1 (ABNT NBR ISO 6892-1 in Brazil).
| Quantity | Formula | Unit |
|---|---|---|
| Original cross-sectional area (round / flat) | S0 = π·d0² / 4 or S0 = a0·b0 | mm² |
| Proportional gauge length | L0 = 5.65·√S0 (for round specimens, 5·d0) | mm |
| Engineering stress | σ = F / S0 | MPa (N/mm²) |
| Engineering strain | ε = ΔL / L0 | dimensionless or % |
| Modulus of elasticity | E = Δσ / Δε in the linear portion | GPa |
| Tensile strength | Rm = Fm / S0 | MPa |
| Elongation after fracture | A = (Lu − L0) / L0 × 100 | % |
| Reduction of area | Z = (S0 − Su) / S0 × 100 | % |
| True stress and true strain (up to Fm) | σV = σ(1 + ε); εV = ln(1 + ε) | MPa; dimensionless |
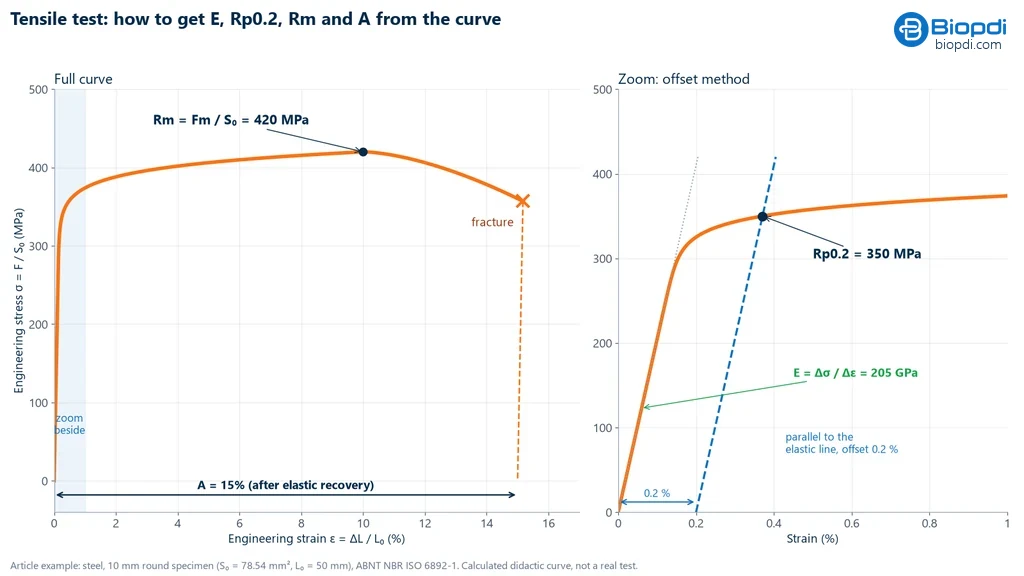
Yield strength by the offset method. When the material has no yield plateau, a line is drawn parallel to the elastic portion and offset by 0.2% on the strain axis. The point where it intersects the curve is Rp0.2. The modulus of elasticity is the slope of the linear portion, which is Hooke's law. For details, see modulus of elasticity and ultimate tensile strength.
The graph below shows these readings on a steel curve, using the same numbers as the worked example that follows: the modulus from the slope of the straight portion, Rp0.2 from the offset, Rm at the highest point and elongation A after elastic recovery.
Worked example: from test to result
A round steel test specimen with d0 = 10.00 mm was tested to ISO 6892-1 with an extensometer. Readings: force at the 0.2% offset of 27.5 kN, maximum force of 33.0 kN, final gauge length of 57.5 mm, diameter at the neck of 6.20 mm. In the elastic portion, between 50 and 150 MPa, the extensometer read 0.02439 mm.
- Area: S0 = π × 10² / 4 = 78.54 mm².
- Gauge length: L0 = 5.65 × √78.54 = 50.07 mm, in practice 50 mm (5d0).
- Yield: Rp0.2 = 27,500 / 78.54 = 350 MPa.
- Strength: Rm = 33,000 / 78.54 = 420 MPa.
- Modulus: Δσ = 100 MPa; Δε = 0.02439 / 50 = 0.000488; E = 100 / 0.000488 = 205 GPa.
- Elongation: A = (57.5 − 50) / 50 × 100 = 15.0%.
- Reduction of area: Su = π × 6.20² / 4 = 30.19 mm²; Z = (78.54 − 30.19) / 78.54 × 100 = 62%.
| Specimen | d0 (mm) | S0 (mm²) | Rp0.2 (MPa) | Rm (MPa) | E (GPa) | A (%) | Z (%) |
|---|---|---|---|---|---|---|---|
| 1 | 10.00 | 78.54 | 350 | 420 | 205.0 | 15.0 | 62 |
The row above is already in report format, using the rounding the standard recommends unless the product standard sets a different rule: strengths to the nearest whole MPa, elongation to 0.5% and reduction of area to 1%. The values are consistent with a cold-drawn 1020 steel. This is a teaching example.
Plastic, ASTM D638 Type I. A cross-section of 13.0 × 3.2 mm = 41.6 mm² and a maximum force of 2.08 kN give σ = 2,080 / 41.6 = 50.0 MPa. If the test lasted 40 s, the speed was too high: D638 calls for the lowest speed that breaks the specimen in 0.5 to 5 minutes.
What goes in the tensile test report
Under ISO 6892-1 (clause 22), the report must include at least:
- the standard and the testing rate condition code (for example, "ISO 6892-1:2019 A224");
- the identification and type of the test specimen;
- the material, if known, and the location and direction of sampling;
- the control mode and rates, when they differ from the recommended ones;
- the rounded results.
In laboratory practice, labs also add the curve, the operator, the machine and its calibration date (ISO 7500-1, ABNT NBR ISO 7500-1 in Brazil), the extensometer class (ISO 9513, ABNT NBR ISO 9513 in Brazil) and the mean and standard deviation of several specimens. The testing software builds this report with the curves overlaid.
Tensile testing by material
The test is the same, but the standard, the test specimen, the grips and what you look for in the curve change from one material to another.
Steel and rebar
For steel, the test follows ISO 6892-1 (ABNT NBR ISO 6892-1 in Brazil) or ASTM E8, with the yield strength taken by the 0.2% offset method or, in steels with a yield point plateau, as the upper and lower yield strengths. Typical values, which depend on the condition and the bar size:
| Steel and condition | Yield strength (MPa) | Rm (MPa) | A in 50 mm (%) | Source |
|---|---|---|---|---|
| AISI 1020 cold drawn | 350 | 420 | 15 | AZoM |
| AISI 1045 hot rolled | 310 | 565 | 16 | AZoM |
| AISI 1045 cold drawn | 450 | 585 | 12 | AZoM |
| AISI 4140 annealed | 415 | 655 | 25.7 | AZoM |
The modulus of elasticity of all of them lies between 190 and 210 GPa: heat treatment changes the strength, not the stiffness. See modulus of elasticity of steel.
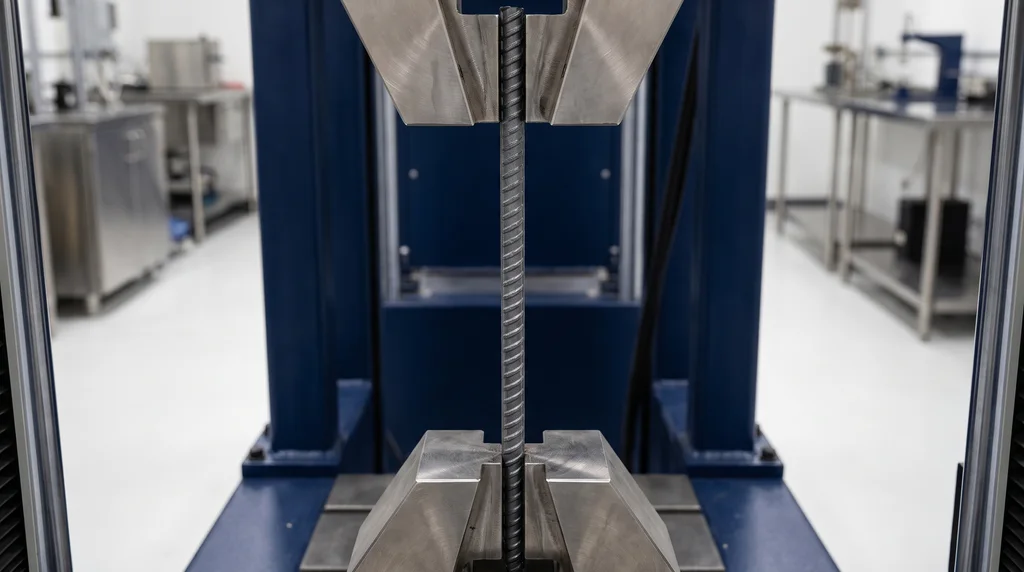
CA-50 rebar. ABNT NBR 7480:2024 (the Brazilian standard for steel reinforcing bars) requires CA-50, a Brazilian rebar grade, to have a yield strength of at least 500 MPa, a minimum ratio between tensile strength and yield strength, and an elongation of at least 8% over 10 diameters. Example with a 12.5 mm bar (nominal area of 122.7 mm²): a yield force of 67.0 kN gives fy = 546 MPa; a maximum force of 83.5 kN gives fst = 680 MPa, a ratio of 1.25; with L0 = 125 mm and Lu = 141.5 mm, A = 13.2%. The bar complies. The minimums for the three grades are in ductility. The photo below shows a rebar held in wedge grips: the bar is tested whole, without machining.
Polymers and composites
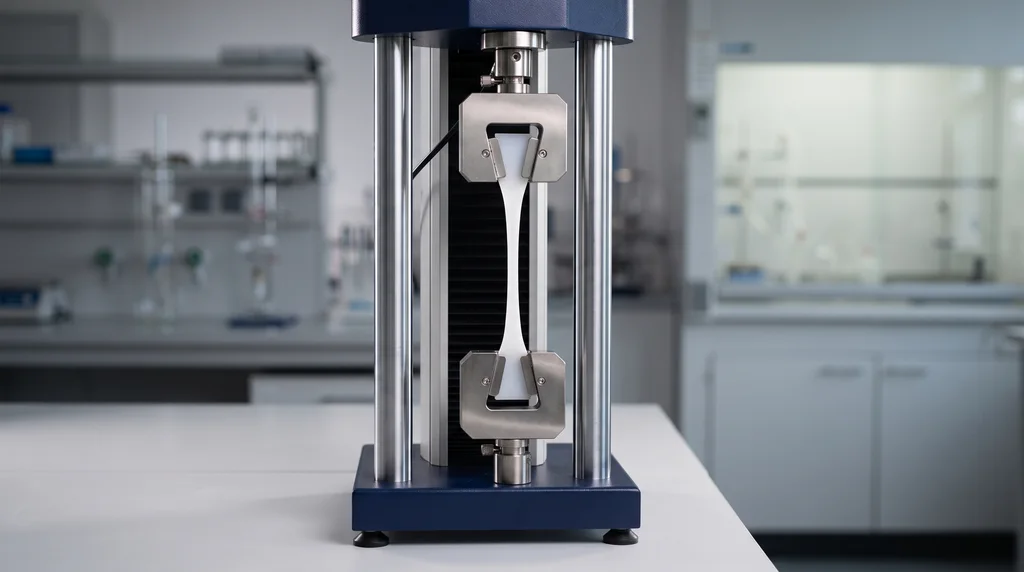
Rigid and semi-rigid plastics follow ASTM D638-22, with a dog-bone (dumbbell) specimen (Types I to V) up to 14 mm thick; films less than 1 mm thick go to ASTM D882. The result depends strongly on speed, temperature and humidity, so the specimen is conditioned beforehand (23 °C and 50% relative humidity). The ISO equivalent is ISO 527-2, revised in 2025. Fiber composites follow ASTM D3039, with a rectangular specimen and tabs bonded to the ends. The photo below shows a plastic dog-bone specimen mounted in the grips.
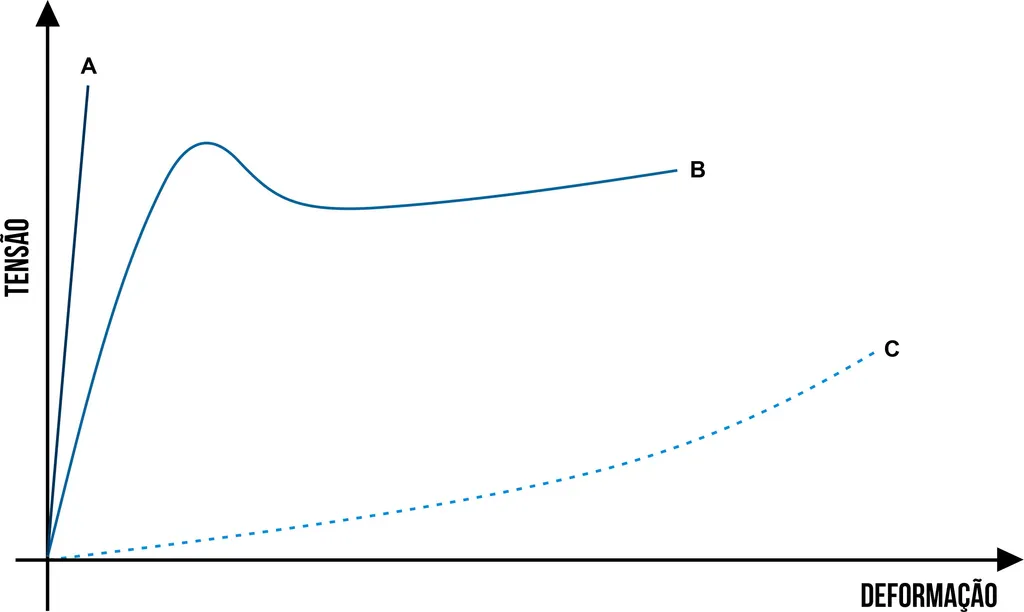
Polymers are much more sensitive to test speed and temperature than metals, and they deform by different mechanisms. That is why there are three typical curve shapes: the brittle polymer (A), which fractures right after the elastic region; the ductile polymer (B), which yields, forms a neck that propagates along the specimen and elongates a great deal; and the elastomer (C), which stretches several times its own length at low stress. The three shapes are in the graph below.
Concrete
Concrete is hardly ever tested in direct tension. In Brazil, the splitting tensile test is used (ABNT NBR 7222:2011, the Brazilian standard for the splitting tensile strength of concrete, equivalent to ASTM C496): a cylinder lying on its side is compressed along its length and fct,sp = 2F / (π·d·L). A 100 × 200 mm cylinder that fails at 110 kN has 3.50 MPa. The test is performed on a compression testing machine; see compression test.
Ceramics
Ceramics are hard but brittle, and are rarely tested in tension: any crack introduced during manufacturing or when clamping the specimen makes the part fail prematurely, and the grips tend to break them. That is why the strength of ceramics is generally measured by flexural testing in 3 or 4 points, with bar-shaped specimens.
Why use an extensometer in the tensile test
Strain can be measured in two ways, and the difference starts with which part of the specimen is measured. Without an extensometer, strain is calculated from the crosshead displacement, and what elongates in that calculation is the entire specimen between the grips: the gauge section, the fillets and the part of the grip ends outside the wedges. Only in the gauge section is the cross-section constant and the stress equal to the calculated value (F/S0); in the fillets and grip ends the cross-section is larger, the stress is lower and so is the strain, so the average over the whole specimen does not represent the material. In addition, the crosshead displacement is not only that of the specimen: it adds the elastic deformation of the machine itself (columns, load cell, adapters), that of the grips, the seating of the wedges at the start of the test and any slippage. In the elastic region, where the specimen elongates only a few hundredths of a millimeter, these contributions are larger than that of the material itself.
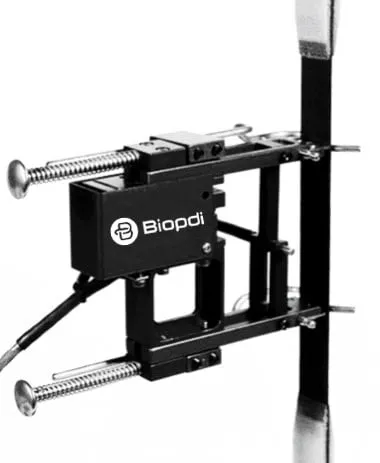
With an extensometer, strain is measured only in the region of interest. It is attached to the specimen itself, with two knife edges resting on the gauge section and separated by the gauge length L0, where the cross-section is uniform and the stress is known, and it measures only the elongation that occurs between them: nothing from the machine, the grips or the fillets enters the reading. The photo below shows a Biopdi extensometer attached to a flat specimen.
To show the size of the difference, the graph below shows the same test measured both ways, with the numbers from the worked example (steel, Rp0.2 of 350 MPa, Rm of 420 MPa, E of 205 GPa). The force is the same in both curves; only the strain changes. On the left is the full curve: the crosshead curve, in orange, is shifted to the right from start to finish and ends at 20% elongation, versus 15% for the specimen. In the graph below, on the right, is an enlarged view of the start of the curve, which is where the modulus and the yield strength are obtained.
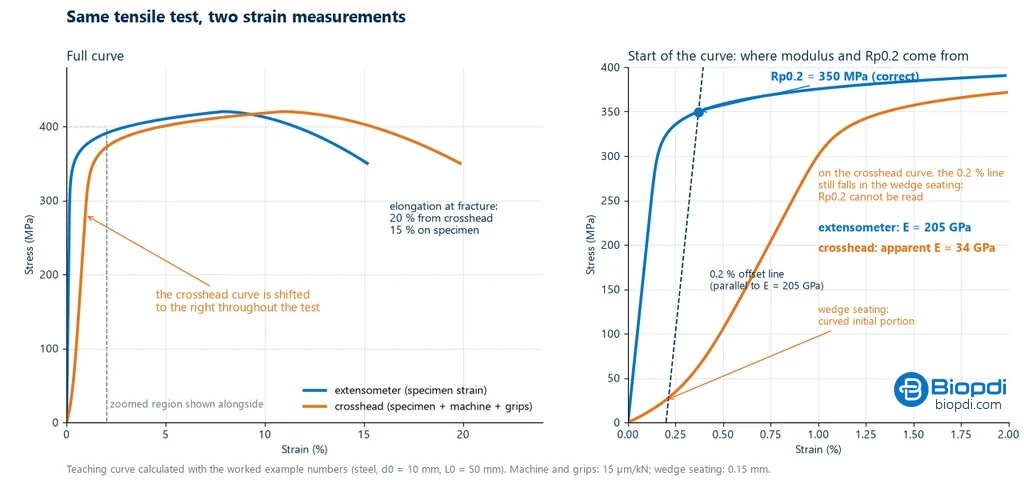
The enlarged view shows the effects of measuring by the crosshead:
- Curved initial region. While the wedges seat on the specimen, the crosshead moves without the material deforming in the same proportion. The curve starts crooked, and the straight region only appears later.
- Very low modulus of elasticity. From the crosshead, the slope of the straight region gives an apparent modulus of about 34 GPa, versus the 205 GPa of steel measured by the extensometer. The apparent value is not a material property: it changes with the machine, the grips and the specimen length.
- Yield strength impossible to read. Rp0.2 is read where the curve crosses the line parallel to the elastic region, offset by 0.2%. On the extensometer curve, this gives the correct 350 MPa. On the crosshead curve, the same line still falls within the wedge seating, and the result is meaningless.
- Higher elongation. Because the crosshead measures the whole specimen, the calculation includes grip play and slippage, machine deformation and what the fillets deform next to the gauge section. The grip ends, with a larger cross-section, barely deform, but the total still comes out higher than the actual elongation of the material.
The graph above is calculated, to isolate the effect of the measurement. The graph below is from a real aluminum test, with two specimens of the same material in different conditions: the one in the black curve was heat treated and measured without an extensometer, by the crosshead; the one in the red curve, untreated, was measured with an extensometer. Both effects appear together. The higher tensile strength of the black curve, about 180 MPa versus 130 MPa, comes from the heat treatment, not from the measurement, because Rm depends only on force. The much greater elongation of the black curve, however, combines both causes: the treated material and the deformation of the machine and grips that the crosshead includes.
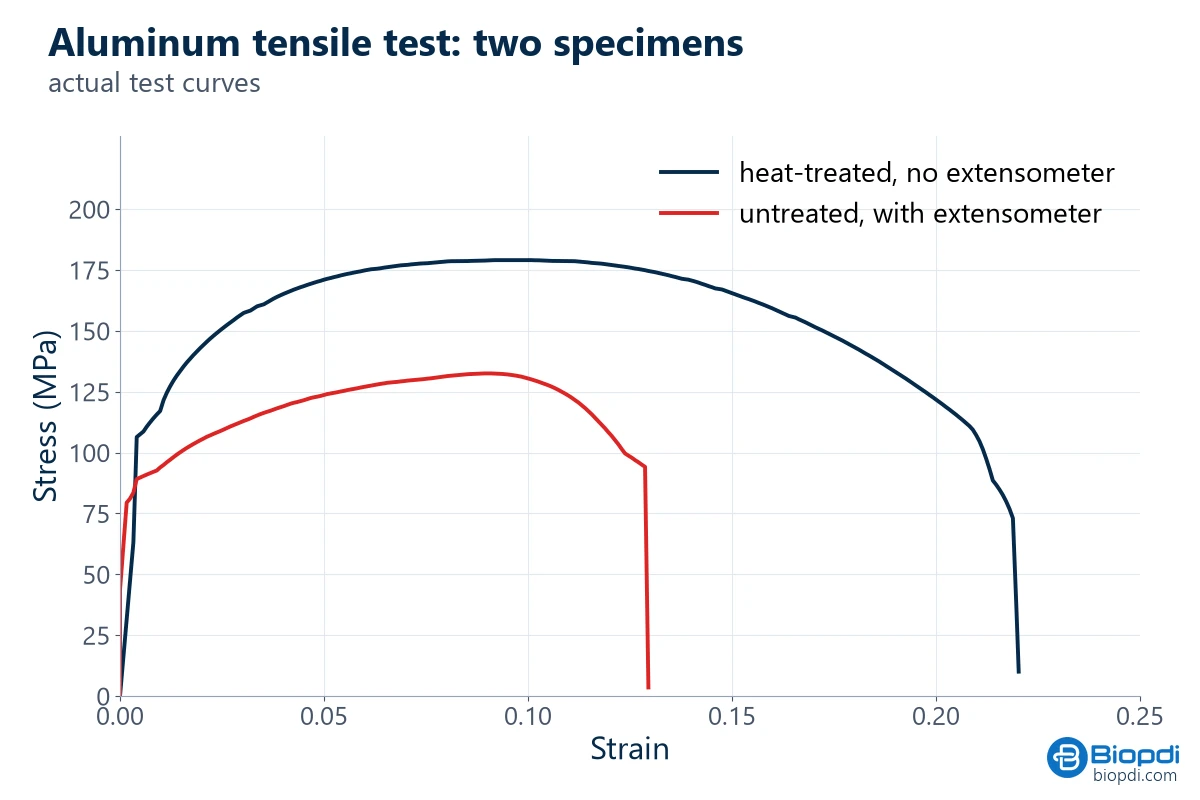
So if the test only needs Rm, the crosshead is enough. For the modulus, the proportional limit and a reliable Rp0.2, the extensometer is essential. Elongation after fracture is a different case: under ISO 6892-1, it is measured on the gauge length marks, by fitting the two halves of the specimen together after the test, or by the extensometer; not by the crosshead, except to complete the measurement after the extensometer has been removed past the maximum force, as Annex A of the standard allows, in a verifiable way. The standard requires a class 1 extensometer per ISO 9513 for proof strength (Rp and Rt) and accepts class 2 for properties with extension above 5%, and the type of extensometer must be stated in the report when the modulus is determined. Comparing two materials also requires that both be measured the same way.
The extensometer also has a limitation: it only sees what happens between the knife edges. If necking and fracture occur outside the gauge length, the reading does not capture the elongation concentrated in the neck. That is why ISO 6892-1 has rules for the fracture location (the result is valid if it lies at least L0/3 from the nearest mark, or if A already reaches the specified minimum), and many laboratories remove the extensometer after yielding, to protect it from the impact of fracture, and measure the final elongation from the marks.
Extensometers in tensile testing of polymers
In polymers the cause of the problem changes, but it does not go away. Machine deformation matters less, because the specimen is dozens of times more compliant than the machine and the forces are low. On the other hand, other effects grow. The fillets and grip ends of a dog-bone specimen have the same low modulus as the gauge section and a cross-section only about twice as large, so they deform considerably and enter the crosshead reading. The polymer slips and thins inside the grips, because the material flows under the pressure of the wedges. And, in ductile polymers, the neck propagates along the specimen and can advance into the fillets, so the crosshead elongation departs even further from the elongation in the gauge section.
That is why plastics standards separate the two quantities. For the tensile modulus, ISO 527-1 requires a class 1 extensometer per ISO 9513, and ASTM D638 requires a class B-2 extensometer per ASTM E83; crosshead displacement cannot replace it. After yielding, the logic is reversed. In plastics that neck, the neck may form outside the knife edges, and the extensometer would stop capturing the elongation. Both standards then use nominal strain: the crosshead displacement divided by the initial grip separation. In the preferred method of ISO 527-1 for multipurpose specimens, strain comes from the extensometer up to yield and from the crosshead after it, and the result is reported as nominal, without being compared with a strain measured only in the gauge section. For elastomers and films, which stretch several times their own length, long-travel extensometers or non-contact optical measurement are used.
Interactive simulation
The simulator runs a complete tensile test in your browser. You choose the material from six references (SAE 1020 steel, quenched SAE 4340 steel, 6061-T6 aluminum, annealed copper, gray cast iron and polypropylene) and watch the stress-strain curve being plotted point by point, with the test specimen elongating, necking and fracturing next to the graph.
The variable that matters is how strain is measured. Measuring from the crosshead, the reading includes the compliance of the machine, the grips and the load cell; measuring with an extensometer, only the elongation of the material is recorded. The simulator shows both curves together and calculates the error: for the simulator's SAE 1020 steel, the modulus of elasticity drops from 205 GPa to about 90 GPa, a deviation of more than 50%. On a real machine, with the seating of the wedges and the play in the grips, the drop is usually even larger, as in the graph calculated in the section above. For polypropylene, the error caused by the machine alone falls to about 1%, because the specimen is much more flexible than the machine. The simulator represents only this effect: in a real polymer, deformation of the shoulder fillets and slippage in the grips still distort the reading, which is why plastics standards also require an extensometer for the modulus.
At the end of the test, the report gives the ultimate tensile strength, the yield strength, the modulus of elasticity, the elongation, the reduction of area, the approximate toughness and the σr/σe ratio, and classifies the behavior as ductile or brittle. The values are reference values, in the usual range of engineering tables, and are meant to help you understand the shape of the curve for each class of material. They do not replace real testing, since properties vary with composition, heat treatment, rolling direction and temperature.
Tensile testing standards
Which standard to use depends on the material and the customer: a product made in Brazil usually calls for NBR ISO 6892-1; exports to the United States, ASTM E8. The two are not identical: the temperature (10 to 35 °C in ISO, 10 to 38 °C in ASTM), the gauge length (5d in ISO and E8M, 4D in E8) and the speed control differ, and elongation can only be compared between tests performed with the same gauge length.
The table lists the most widely used tensile testing standards, by material:
| Standard | Application | Current edition |
|---|---|---|
| ABNT NBR ISO 6892-1 | metals, room temperature | 2024, identical to ISO 6892-1:2019 (replaces the 2013 edition; corrected version of July 2026) |
| ABNT NBR ISO 6892-2 | metals, elevated temperature | 2024 |
| ASTM E8/E8M | metals | E8/E8M-25 |
| ASTM A370 | steel products | A370-26 |
| ABNT NBR 7480 | bars and wires for reinforced concrete (Brazil) | 2024 (equivalent to the 2022 edition corrected with Amendment 1) |
| ASTM D638 | rigid and semi-rigid plastics | D638-22 |
| ISO 527-2 | plastics (molding and extrusion) | 2025 |
| ASTM D882 and ISO 527-3 | thin plastic films and sheeting | |
| ASTM D412 | rubbers and elastomers | |
| ASTM D3039 | polymer matrix composites | |
| ASTM D5034 and D5035 | textiles: grab method and strip method | |
| ASTM D6319 | nitrile medical gloves (product specification; tensile testing follows ASTM D412) | |
| ASTM D1414 | rubber O-rings | |
| ASTM F2458 | tissue adhesives and sealants | |
| ABNT NBR 7222 | concrete, splitting tensile test (Brazil) | 2011 |
| ABNT NBR ISO 7500-1 and 9513 | calibration of the machine and the extensometer | 7500-1: 2023; 9513: 2013 |
Common mistakes in tensile testing
- Measuring the modulus or yield strength from the crosshead. It underestimates the modulus. Use an extensometer.
- Grip slippage. It shows up as a step or a serrated pattern in the curve before yielding. Fix it with wedges suited to the hardness, more clamping pressure or bonded tabs.
- Misalignment. It causes bending, fracture at the grip and low strength.
- Speed outside the standard. Yield strength is sensitive to the rate. Record the test condition code and never speed up the machine during yielding.
- Fracture outside the middle third. It invalidates the elongation, unless it already meets the minimum.
- Using the nominal dimension on a machined specimen. A machined specimen uses the measured dimension. Rebar is not measured with a caliper: under NBR 7480, the area is that of a cylinder with the same mass per meter as the bar, obtained by weighing.
- Confusing engineering stress with true stress. Rm is not the actual stress at fracture.
Tensile testing machine: how to choose the capacity
The maximum expected force is the strength times the area: Fm ≈ Rm × S0. Choose a machine with a margin above that value. A hot-rolled 1045 steel (565 MPa) in a 12.5 mm specimen (122.7 mm²) breaks at around 69 kN, and a 12.5 mm CA-50 rebar (a Brazilian reinforcing steel grade) at around 84 kN. Both call for the 100 to 200 kN range.
The Biopdi universal testing machine is electromechanical. A motor drives the screws that move the crosshead, with fine speed and position control, which is what tensile testing standards require. The grips hold the test specimen and keep it aligned with the axis. The most common grip types are wedge, threaded and flange. The load cell measures the force at every instant, the encoder measures crosshead displacement and the extensometer measures elongation on the specimen itself. The software controls the test, plots the curve and generates the report. An accurate result depends as much on using the machine correctly as on the machine itself: the load cell must be sized for the test force, and the extensometer must be used in the elastic range. The panel below shows the machine, the role of each part in the tensile test and the grips used.
The universal testing machine in the tensile test
The M2 line has single-column models from 200 N to 10 kN and dual-column models from 5 kN to 1,000 kN. Each part of the machine has a role in the test:
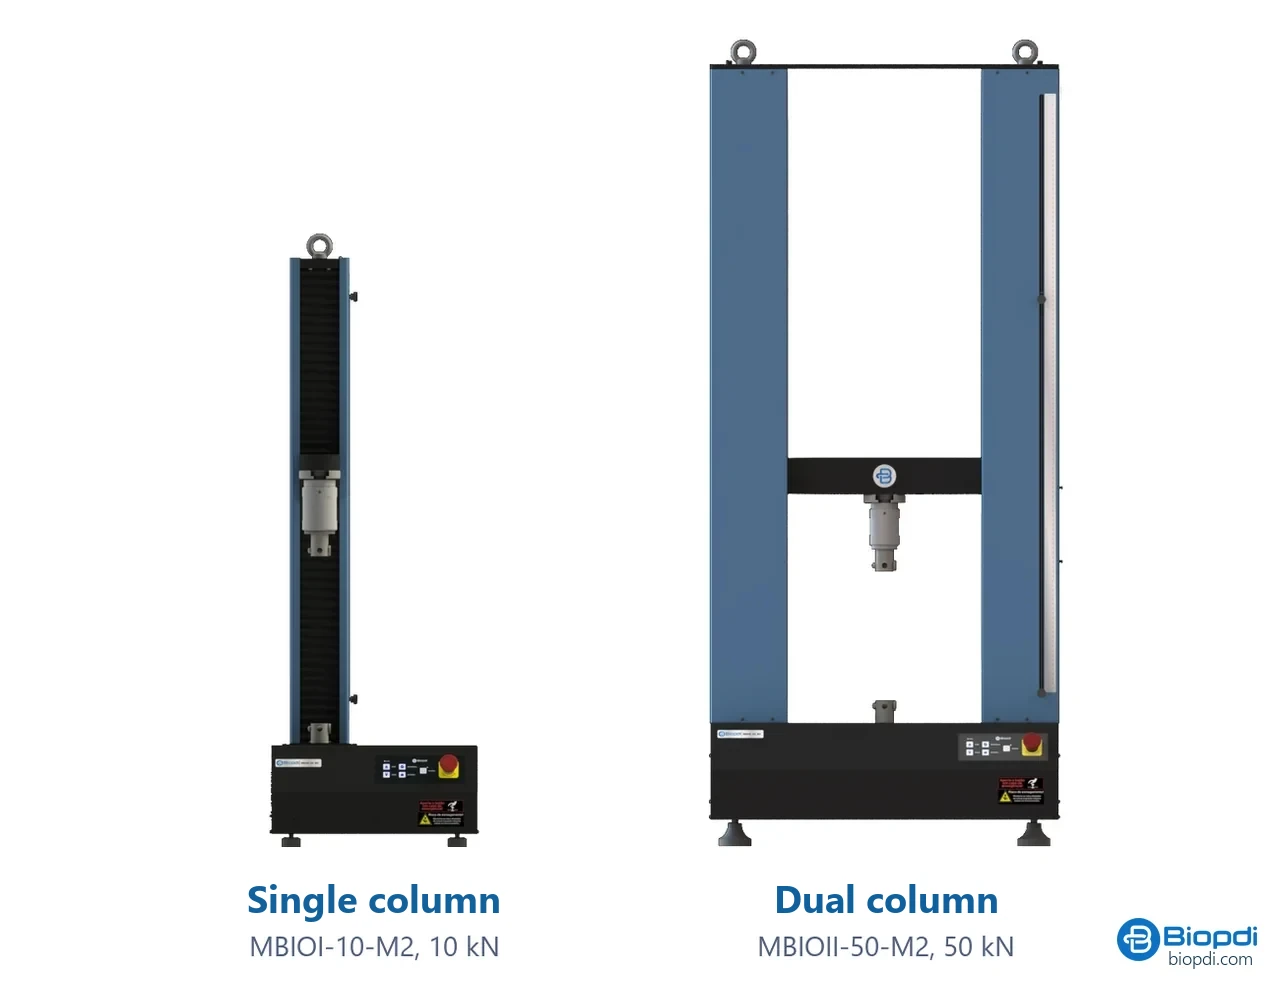
- Moving crosshead: pulls the grips apart at the speed set by the standard
- Load cell: measures the force, class 1
- Grips: wedge, pneumatic, for threaded specimens or for wires
- Extensometer: measures elongation for the modulus and Rp0.2
- BioLab software: curve, Rm, yield, elongation and report
- Control panel and emergency stop: positions and stops the test
Tensile test fixtures
The fixtures below mount on the same machine, depending on the test specimen and the standard:
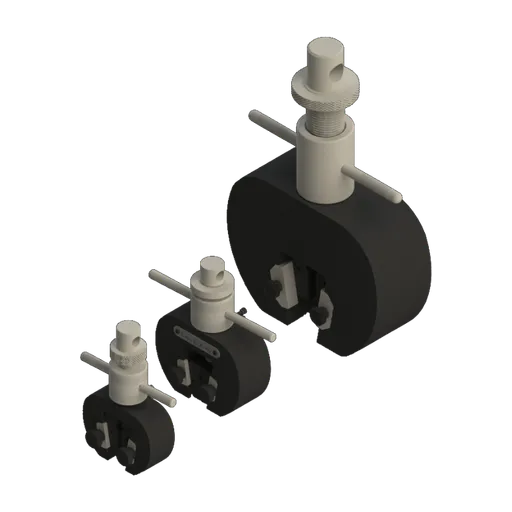 Wedge grip5, 20 and 200 kN
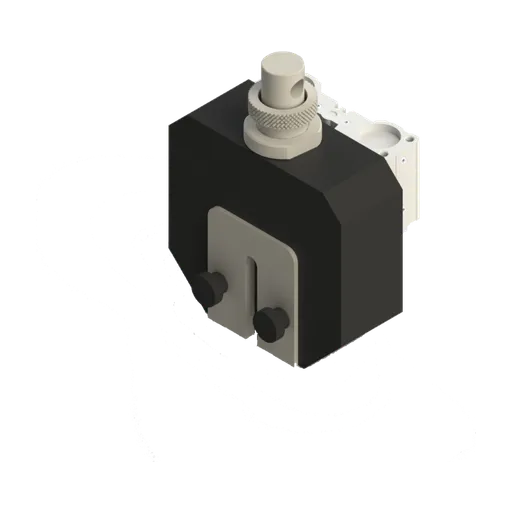 Pneumatic wedge grip50 and 200 kN
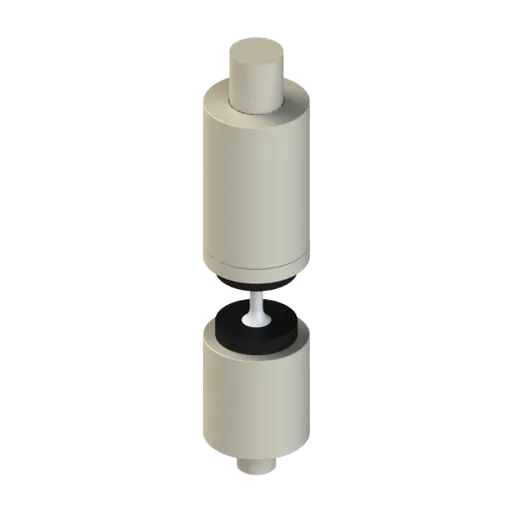 Grip for threaded specimensbolts and threaded test specimens
| Material and test specimen | Force range | Biopdi model |
|---|---|---|
| Films, fine wires, tapes | 200 N to 1 kN | MBIOI-1P-M2 |
| Plastics (D638, ISO 527), elastomers, textiles | 2 to 10 kN | MBIOI-10-M2 (extended column for high elongation) |
| Metal sheets, composites, fasteners | 5 to 50 kN | MBIOII-50-M2 |
| Rebars, bars, profiles, cables | 100 to 200 kN | MBIOII-200-M2 |
| Thick bars, high-load cables | 300, 600 and 1,000 kN | MBIOII-300-M2, 600-M2, 1000-M2 |
For materials that stretch a lot, such as rubbers and ductile plastics, also check the crosshead travel. That is what the extended column is for. How the machine works internally is covered in universal testing machine.
Tensile test videos
Tensile tests on steel and on a polymer run on Biopdi universal testing machines, plus an overview of the 100 kN model.
Other tests and technical references
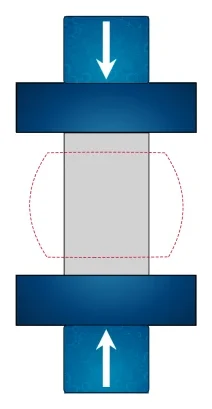
Tests performed on the Biopdi universal testing machine







Related technical references
ASTM D412 and ISO 37: rubber tensile test, test specimens, speed and calculations
ASTM D412 and ISO 37 rubber tensile test: dumbbell or ring at 500 mm/min, tensile strength, elongation at break and stress at 100% and 300%.
ASTM D695: compression testing of rigid plastics (test specimen, 1.3 mm/min and calculations)
ASTM D695-26 measures compressive strength, yield and modulus of rigid plastics: a 12.7 × 12.7 × 25.4 mm prism at 1.3 mm/min. Calculations and ISO 604.
NBR 5739 concrete compression test: fc calculation and the NBR 7222, NBR 12142 and NBR 6136-2 standards
ABNT NBR 5739:2018 (the Brazilian standard for concrete compression testing), reaffirmed in 2023, covers compression testing of cylindrical concrete specimens: continuous loading at 0.45 ± 0.15 MPa/s until failure and fc = 4F/(πD²), in MPa, to three significant figures. See what it requires of the machine and the specimen, the h/d correction, failure types A to G and the related standards: NBR 7222 (splitting tensile test), NBR 12142 (flexural tensile strength) and NBR 12118, withdrawn in February 2026 and replaced by NBR 6136-2:2026.
Frequently asked questions
What is the tensile test?
It is a destructive mechanical test that applies an axial tensile force to a standardized test specimen, increasing at a controlled rate until fracture. The force-elongation curve gives the yield strength, the ultimate tensile strength, the modulus of elasticity, the elongation and the reduction of area (necking).
Which ABNT standard covers the tensile test?
ABNT is the Brazilian standards body. For metals at room temperature, the standard is ABNT NBR ISO 6892-1:2024, identical to ISO 6892-1:2019. It cancels and replaces the 2013 edition, and a corrected version was issued in July 2026. Part 2, ABNT NBR ISO 6892-2:2024, covers elevated temperature. Rebars must also meet the requirements of ABNT NBR 7480:2024 (the Brazilian standard for steel reinforcing bars).
What is the ASTM D638 tensile test?
It is the ASTM method for measuring the strength, elongation and modulus of rigid and semi-rigid plastics. It uses a dumbbell-shaped (dog-bone) test specimen (Types I to V) up to 14 mm thick. The current edition is D638-22. Films under 1 mm thick are tested to ASTM D882.
How is tensile stress calculated?
Divide the force by the original cross-sectional area: σ = F / S0, in N/mm², which is the same as MPa. Tensile strength uses the maximum force: Rm = Fm / S0. For example, 33.0 kN on a 10 mm specimen (78.54 mm²) gives 420 MPa.
How is tension measured?
With a universal testing machine. The load cell measures the force and the extensometer measures elongation over the gauge length. The machine class is defined by ISO 7500-1 (ABNT NBR ISO 7500-1 in Brazil) and the extensometer class by ISO 9513 (ABNT NBR ISO 9513 in Brazil).
How is the tensile test diagram produced?
The software records force and elongation and divides them by the original area and the gauge length, producing the stress-strain curve. From it you read the modulus (slope), the yield strength by the 0.2% offset method, the tensile strength (peak) and the elongation (fracture).
How is a tensile test report prepared?
Under ISO 6892-1, the report states the standard with the testing rate code, the identification and type of the test specimen, the material, the sampling location and direction, and the results rounded as the standard recommends unless the product standard sets another rule: strengths to the nearest whole MPa, elongation to 0.5% and reduction of area to 1%.
What is the tensile test speed?
In method A of ISO 6892-1, the recommended values are 0.00025 s⁻¹ (±20%) up to yield and 0.0067 s⁻¹ (±20%) after it. In ASTM E8, control method A, the stress rate in the elastic range is between 1.15 and 11.5 MPa/s, per E8/E8M-09.
What test specimen should be used for the tensile test?
For metals, the ISO proportional specimen has L0 = 5.65√S0, for example 10 mm diameter with a 50 mm gauge length. In ASTM E8, the standard round specimen is 12.5 mm in diameter with a 50 mm gauge length. For plastics, the D638 Type I specimen is 13 mm wide with a 50 mm gauge length.
What is the tensile test temperature?
In ISO 6892-1, from 10 to 35 °C, or 23 ± 5 °C when the test requires controlled conditions. In ASTM E8, from 50 to 100 °F, that is, from 10 to 38 °C.
Why use an extensometer instead of crosshead displacement?
Because crosshead displacement adds the deformation of the machine and the grips to that of the test specimen, so the modulus of elasticity comes out far below the real value. The extensometer measures only the specimen, within the gauge length.
How is the tensile test done on concrete?
It is done indirectly, by diametral compression of a cylinder (the splitting tensile test), per ABNT NBR 7222:2011 (the Brazilian standard for this test): fct,sp = 2F / (π·d·L). A 100 × 200 mm cylinder that fails at 110 kN has a tensile strength of 3.5 MPa.