
The elastic limit is the highest stress a material can withstand without retaining any permanent deformation after unloading. The yield strength is the stress at which plastic deformation begins in a measurable way: ReH and ReL in steel with a yield plateau, Rp0.2 in other materials. Because the two are very close in metals and only yield can be measured reproducibly, engineering specifies, tests and designs by yield strength.
Yield strength is calculated as Re = Fe / S0, the force at yield divided by the original cross-sectional area, in MPa (N/mm²). Two reference figures give the order of magnitude: ASTM A36 structural steel has a minimum yield strength of 250 MPa, and CA-50 rebar (the Brazilian reinforcing bar grade) has a characteristic value of 500 MPa. This article covers the elastic limit of materials, measured in the tensile test: it starts with the definitions, moves on to reading the values on the curve and to the values for steel, and ends with worked examples and the testing equipment.
Proportional limit, elastic limit and yield strength: the difference
The three limits mark the end of different behaviors on the same stress-strain curve, and they are often treated as synonyms. The most common confusion, even in technical texts, is saying that the elastic limit is the same as the proportional limit. It is not: one marks the end of linearity, the other the end of reversibility.
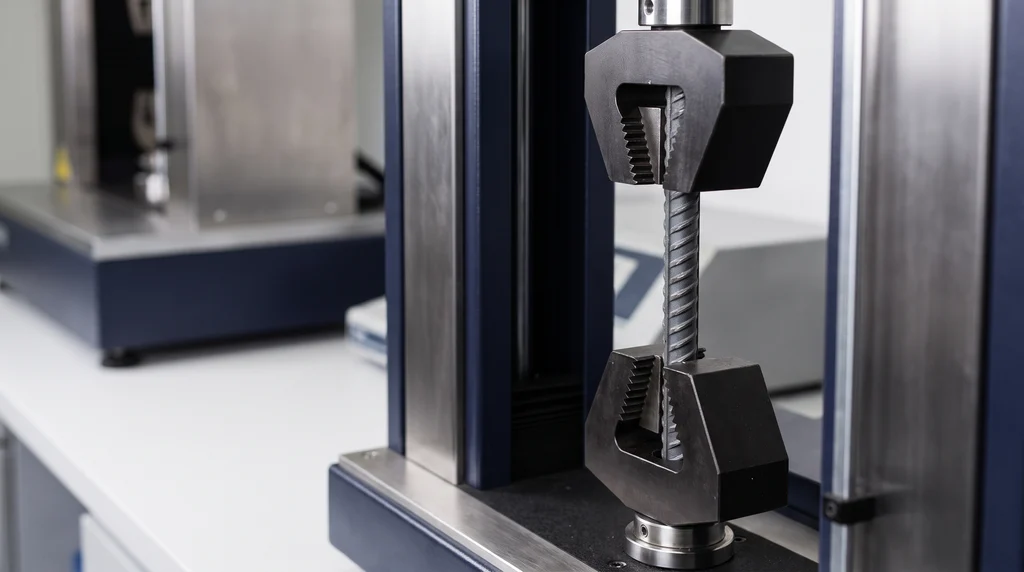
In the photo, a ribbed steel bar (rebar) held in the wedge grips of the universal testing machine: this tensile test determines the yield strength that classifies CA-50 steel.
The three definitions
The proportional limit is, according to ASTM E6, the greatest stress a material can sustain without deviating from proportionality between stress and strain, that is, the end of the range in which Hooke's law applies, σ = E·ε. The standard itself warns that the value read depends on the sensitivity of the equipment, the eccentricity of loading and the scale of the plot.
The elastic limit is, according to the same ASTM E6, the greatest stress a material can sustain without any permanent strain remaining after complete unloading. In practice, the standard allows the initial and final readings to be taken at a small reference force instead of zero force. A material can remain elastic after it stops being linear: elastomers and concrete behave this way. That is why the proportional limit is, strictly speaking, equal to or lower than the elastic limit.
Yield strength is defined by ISO 6892-1:2019. For a material that exhibits a yield phenomenon, it is the stress at which plastic deformation occurs without an increase in force, with two values: the upper yield strength, ReH, and the lower yield strength, ReL. For a material without this phenomenon, a proof strength is used, such as Rp0.2, the stress that leaves 0.2% plastic extension. Both cases are detailed in the section on the curve.
The order on the curve is therefore: proportional limit ≤ elastic limit ≤ proof strength, and all of them lie below the ultimate tensile strength. In metals the first three are very close, and the elastic strain at yield in steel is on the order of 0.1% to 0.2%. The table summarizes the comparison.
| Limit | What it marks | How it is obtained | Definition |
|---|---|---|---|
| Proportional | end of the linear relationship σ = E·ε | deviation from the straight line; depends on resolution | ASTM E6 |
| Elastic | highest stress without permanent deformation | loading and unloading cycles, or a specified permanent set | ASTM E6 |
| Yield | onset of measurable plastic deformation | ReH/ReL on the plateau or Rp0.2 by the offset method | ISO 6892-1:2019 |
Why engineering uses yield strength, not the elastic limit
The "true" elastic limit depends on the resolution of the instrument: the more sensitive the extensometer, the earlier it detects some residual strain. That is why ASTM E6 accepts a small reference force, and ISO 6892-1 defines the elastic limit in practice by a specified permanent set, the permanent set strength (Rr), or by a very small plastic strain, such as 0.01% or 0.05%. This test requires loading and unloading cycles and is not part of routine testing.
Yield strength, by contrast, is reproducible. ReL is stable and not very sensitive to the procedure, and Rp0.2 can always be read unambiguously from the curve. That is why product standards, such as ASTM A36, ASTM A572, ASTM A240 and ABNT NBR 7480 (the Brazilian standard for steel reinforcing bars), specify minimum yield strengths, never elastic limits. Note the consequence: Rp0.2 already contains, by definition, 0.2% permanent strain. Saying that yield strength is "the maximum stress without permanent deformation" is a simplification; it is a conventional criterion, chosen because it can be measured.
Yield strength on the stress-strain curve
On the stress-strain curve, engineering stress (σ = F/S0) is on the vertical axis and strain (ε = ΔL/L0) on the horizontal axis. The initial portion is straight, with a slope equal to the modulus of elasticity E, about 200 GPa for steels. What happens after this portion splits materials into two groups: those that show a yield plateau and those that pass gradually from the elastic to the plastic regime.
Steel with a plateau: ReH, ReL and Lüders bands
Hot-rolled or annealed low-carbon steels, such as 1020 and CA-50, show discontinuous yielding. The stress rises in a straight line up to a peak, the upper yield strength ReH, defined by ISO 6892-1 as the highest stress value before the first drop in force. The force then drops and the specimen elongates at almost constant stress, oscillating in a serrated pattern. The lowest stress value in this range, disregarding initial transient effects, is the lower yield strength ReL.
To characterize ReH, ISO 6892-1 requires the force drop to be at least 0.5% and to be followed by yielding of at least 0.05%, without the stress rising above the peak again. With a smaller drop, only Re is reported.
During the plateau, deformation is not uniform. Bands of plastic deformation, the Lüders bands, nucleate at the peak (ReH is the nucleation stress) and propagate along the gauge length (ReL is the propagation stress) until they cover all of it. The strain accumulated in this range is the yield point extension, Ae, and measuring it requires an extensometer. Once the plateau ends, the stress rises again through work hardening up to the ultimate tensile strength, Rm.
The mechanism was explained by Cottrell and Bilby in 1949. Interstitial carbon and nitrogen atoms accumulate around dislocations, the line defects whose movement produces plastic deformation, and pin them. ReH is the stress needed to release them; once free, a lower stress, ReL, is enough to keep them moving. If the steel is deformed, unloaded and left to age, the atoms pin the dislocations again and the plateau reappears: this is strain aging.
Material without a plateau: Rp0.2 and Rt0.5
Aluminum, copper, austenitic stainless steel, cold-worked steels and quenched steels pass from the elastic to the plastic regime without a plateau. In these cases there is no point at which the force stops rising, and yield is defined by convention. The most widely used is the proof strength Rp0.2: the stress at which the plastic extension reaches 0.2% of the extensometer gauge length. On the curve, it is read by drawing a line parallel to the elastic portion starting at ε = 0.2% on the horizontal axis; the intersection of this line with the curve gives Rp0.2. This construction is the offset method, detailed step by step further on.
ISO 6892-1 also defines Rt, which uses total extension (elastic plus plastic) instead of plastic extension. Rt0.5, for example, is the stress at which total extension reaches 0.5%, read on the vertical line at 0.5% without drawing a parallel. Some product standards, such as those for pipes, adopt this criterion.
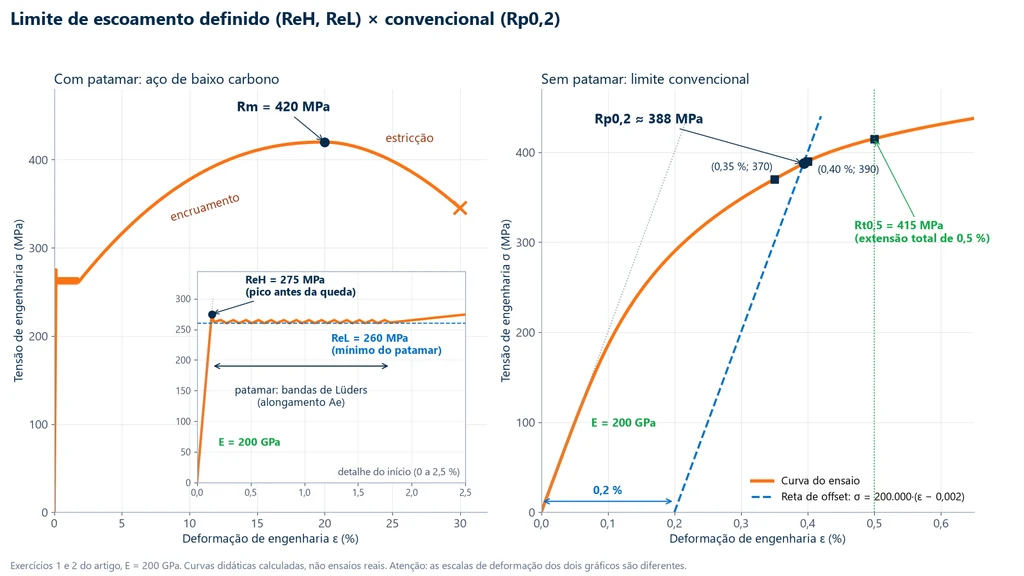
The plots below show the two cases side by side, with the numbers from examples 1 and 2 of this article. On the left, low-carbon steel: the enlarged detail shows the ReH peak of 275 MPa, the serrated plateau with an ReL minimum of 260 MPa and the Lüders bands, and the complete curve rises to an Rm of 420 MPa. On the right, the material without a plateau: the offset line intersects the curve at an Rp0.2 of about 388 MPa, and the vertical line at 0.5% marks an Rt0.5 of 415 MPa. Note that the strain scales of the plots below are different.
ReH or ReL: which one to use
ISO 6892-1 defines both values, but it is the product standard that chooses which one to report. ABNT NBR 7480:2024, the Brazilian standard for rebar, takes fyk as the characteristic value of the upper yield strength. Callister and Rethwisch (Materials Science and Engineering, ch. 6), on the other hand, recommend using the average stress of the lower yield point in design, because it is well defined and not very sensitive to the test procedure. The practical mistake is to compare a laboratory ReH with a standard minimum that refers to ReL, or the other way around: the report must state which of the two was measured.
Yield strength formula and symbols
All yield strengths are engineering stresses: the corresponding force divided by the original cross-sectional area of the specimen, S0. For a cylindrical specimen with diameter d0, the area is S0 = π·d0²/4. With force in newtons and area in mm², the result is in N/mm², which is the same as MPa; 1 ksi equals 6.895 MPa.
- Yield strength: Re = Fe / S0.
- Upper yield strength: ReH = FeH / S0, where FeH is the maximum force before the first drop.
- Lower yield strength: ReL = FeL / S0, where FeL is the minimum force on the plateau, excluding the initial transient.
- Proof strength: Rp0.2 = Fp0.2 / S0, where Fp0.2 is the force at which the plastic extension is 0.2% of the extensometer gauge length.
- Strain at yield: εy ≈ Re / E; for a 250 MPa steel, 250 / 200,000 = 0.00125, or 0.125%.
Symbols vary by source, and recognizing them avoids mistakes when reading certificates and textbooks. ISO 6892-1 and ABNT NBR ISO 6892-1:2024 (the Brazilian adoption of ISO 6892-1) use the letter R with subscripts:
| ISO symbol | Name | When it is used |
|---|---|---|
| Re | yield strength | material with yielding, when upper and lower values are not distinguished |
| ReH | upper yield strength | peak before the first drop in force |
| ReL | lower yield strength | minimum of the plateau, excluding the transient |
| Rp0.2 | proof strength, 0.2% plastic extension | material without a plateau |
| Rt0.5 | proof strength, 0.5% total extension | when the product standard calls for total extension |
Strength of materials textbooks, American standards and reinforced concrete standards use other notations for the same quantity:
| Symbol | Where it appears | Equivalent to |
|---|---|---|
| σy | textbooks (Callister) | yield strength |
| σe | textbooks | yield strength |
| Sy | mechanical design (American literature) | yield strength |
| fy | ABNT NBR 7480 and NBR 6118 (Brazilian standards), reinforced concrete | measured yield strength |
| fyk | ABNT NBR 7480 and NBR 6118 | characteristic yield strength of the lot |
How to determine Rp0.2 by the offset method
The offset method requires knowing the actual strain of the specimen over the gauge length, not the machine displacement. That is why ISO 6892-1 requires an extensometer for Rp and Rt, at least class 1 per ISO 9513. With the stress-strain curve measured this way, the procedure has five steps:
- Convert the curve: divide the force by S0 and the elongation by the extensometer gauge length, Le.
- Obtain the slope of the elastic portion: fit a straight line to the linear portion; the slope is the modulus E used in the construction (ASTM E111 covers the determination of the modulus).
- Draw the offset line: parallel to the elastic portion, shifted by 0.002 on the strain axis, σ = E·(ε − 0.002).
- Find the intersection: locate the two points on the curve between which the line passes from below to above the curve and interpolate between them.
- Read the stress: the stress at the intersection is Rp0.2; the corresponding force is Fp0.2 = Rp0.2·S0.
With Le = 50 mm, a plastic extension of 0.2% corresponds to only 0.100 mm, a magnitude of the same order as the slack in the grips and the deflection of the machine itself; example 5 works through this calculation. Materials with a nonlinear elastic portion, such as polymers and elastomers, do not allow the offset method: they use the stress at a specified strain or the specific definitions of ASTM D638 and ISO 527-1.
Yield strength of steel: table by material and condition
The yield strength of a steel is not a fixed number for the alloy. The same AISI 1045 yields at about 310 MPa hot-rolled and above 500 MPa cold-drawn, and 4140 ranges from about 415 MPa annealed to more than 1,500 MPa quenched and tempered at a low temperature. Every useful table has to state, for each row, the material condition and the type of value:
- Typical value: an average published in datasheets (ASM, manufacturers). It gives the order of magnitude and varies with the heat and the bar size.
- Specified minimum: what the product standard guarantees; it is the design and acceptance value. The "250 MPa" of A36 is a minimum, and mill certificates usually show 280 to 340 MPa.
- Characteristic value: a statistical estimate for a lot, used for reinforced concrete (fyk).
The first table covers carbon and structural steels, with the ultimate tensile strength Rm alongside for the ratio between the two:
| Material and condition | Yield strength (MPa) | Rm (MPa) | Value type and source |
|---|---|---|---|
| AISI 1020 hot-rolled (19 to 32 mm bar) | 205 | 380 | typical (ASM table) |
| AISI 1020 cold-drawn | 350 | 420 | typical (ASM table) |
| AISI 1045 hot-rolled (19 to 32 mm) | 310 | 565 | typical (eFunda) |
| AISI 1045 cold-drawn (19 to 32 mm) | 530 | 625 | typical (eFunda) |
| AISI 1045 annealed | 241 | 448 | typical (MetalData, ASTM A519) |
| ASTM A36, plate, shapes and bar up to 200 mm | ≥ 250 | 400 to 550 | specified minimum (ASTM A36) |
| ASTM A36, plate over 200 mm | ≥ 220 | 400 to 550 | specified minimum (ASTM A36) |
| ASTM A572 Gr 50, shapes and plates up to 100 mm | ≥ 345 | ≥ 450 | specified minimum (ASTM A572) |
| CA-50 (Brazilian rebar grade), hot-rolled ribbed bar | fyk ≥ 500 | fst ≥ 1.10·fy | characteristic (ABNT NBR 7480:2024) |
The second table covers 4140 alloy steel, 304 stainless steel and, for comparison, 6061-T6 aluminum:
| Material and condition | Yield strength (MPa) | Rm (MPa) | Value type and source |
|---|---|---|---|
| AISI 4140 annealed | ≈ 415 | ≈ 655 | typical (Steelstandart) |
| AISI 4140 normalized | ≈ 655 | ≈ 1,020 | typical (Steelstandart) |
| AISI 4140 quenched and tempered at 650 °C | ≈ 655 | ≈ 862 | typical (AlloyFYI) |
| AISI 4140 quenched and tempered at 540 °C | ≈ 895 to 965 | ≈ 1,035 to 1,070 | typical (sources differ) |
| AISI 4140 quenched and tempered at 425 °C | ≈ 1,100 to 1,170 | ≈ 1,240 to 1,310 | typical (Steelstandart, AlloyFYI) |
| AISI 4140 quenched and tempered at 205 °C | ≈ 1,590 to 1,640 | ≈ 1,770 to 1,790 | typical (Steelstandart, AlloyFYI) |
| 304 stainless, annealed (plate and bar) | Rp0.2 ≥ 205 (typical 240 to 300) | ≥ 515 | specified minimum (ASTM A240) |
| 304 stainless, cold-finished bar up to 12.7 mm | ≥ 310 | ≥ 620 | minimum (ASTM A276, condition B) |
| Aluminum 6061-T6 / T651 | 276 | 310 | typical (ASM/MatWeb) |
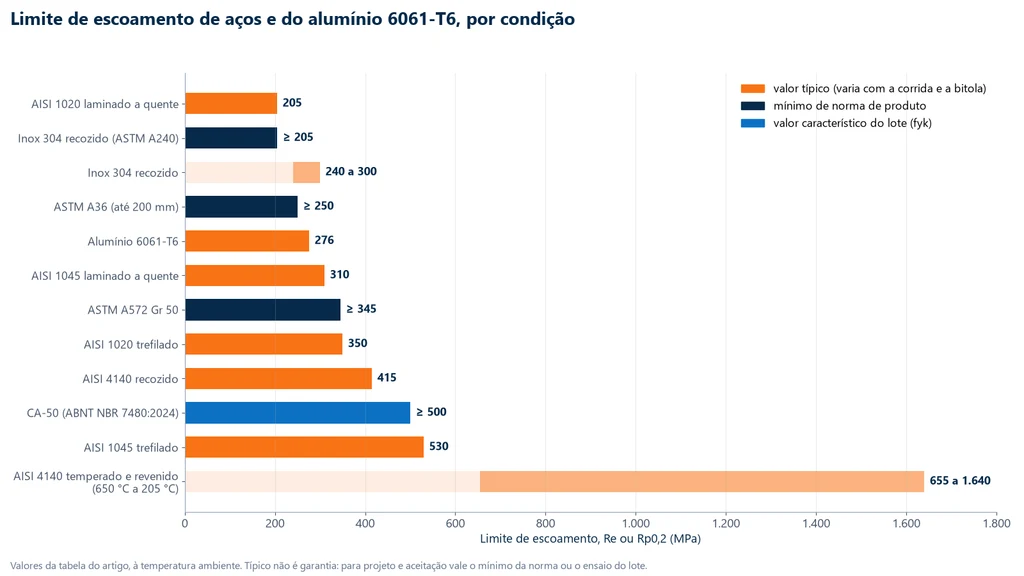
The chart below places the same materials on a single scale, with color indicating the type of value: orange for typical, navy blue for the specified minimum and blue for the characteristic value of CA-50. The light bands are ranges, such as the one for quenched and tempered 4140. It shows how much the condition matters: quenched and tempered 4140 alone covers a wider range than all the other steels combined.
CA-50 steel (ABNT NBR 7480:2024)
CA-50 rebar is hot-rolled and has a stress-strain curve with a yield plateau. ABNT NBR 7480:2024 (the Brazilian standard for steel bars and wires for reinforced concrete) requires a characteristic yield strength fyk ≥ 500 MPa, a tensile-to-yield ratio fst/fy ≥ 1.10 and an elongation after fracture A ≥ 8% over 10 diameters or a total elongation at maximum force Agt ≥ 5%. Many texts still repeat 1.08 for the fst/fy ratio: that was the value in the 2007 edition, now withdrawn.
fyk is a characteristic value: it describes the lot. Under NBR 7480:2024, in an identified lot each of the three specimens in the sample must reach the value, and only in a lot without heat identification is fyk estimated statistically, from 6 or 12 specimens. A single test specimen above 500 MPa does not prove that the lot complies; it only shows that this particular bar yielded above that value. The same standard covers the other grades: CA-25 (250 MPa), CA-60 (600 MPa) and CA-70 (700 MPa).
4140 steel: the range depends on tempering
4140 is the clearest example of why a single number is misleading. Annealed, it yields at about 415 MPa. With quenching followed by tempering, the lower the tempering temperature, the higher the yield strength and the lower the toughness: about 655 MPa tempered at 650 °C and 1,590 to 1,640 MPa tempered at 205 °C. Bar diameter also matters, because quenching does not reach the core of a thick part in the same way: a 50 mm bar quenched and tempered at 540 °C may yield at around 750 MPa, and a 75 mm bar at around 655 MPa (Machado, 2016).
Re/Rm ratio, allowable stress and safety factor
The ratio between yield strength and ultimate tensile strength, Re/Rm, measures the reserve the material has after it yields. A low value, such as the roughly 0.65 to 0.75 of A36, indicates plenty of available work hardening: the part deforms visibly and gives warning before it fractures, which relates to ductility. A high value, typical of quenched and cold-drawn steels, indicates little reserve. The fst ≥ 1.10·fy requirement for CA-50 is equivalent to fy/fst ≤ 0.91 and exists precisely to guarantee this reserve.
In the design of ductile parts, yield strength is the basis for the allowable stress: σadm = Re / n, where n is the safety factor. In brittle materials, which do not yield, the basis becomes Rm. The safety factor is not a material property: it comes from the design code or industry practice, and typically ranges from 1.1 to 2 or more for ductile materials. Yield strength also defines the energy the material absorbs and releases without permanent deformation, its resilience, through the modulus Ur = σy² / (2E).
One limit of validity must be clear: the yield strength measured in the test applies to uniaxial tension. In a part under combined stresses, such as a shaft under bending and torsion, the comparison with yield strength goes through a yield criterion, such as von Mises or Tresca, a topic outside the scope of this article.
What increases or decreases yield strength
Yielding depends on how easily dislocations move. Anything that creates obstacles to that movement raises the yield strength; the modulus of elasticity, which depends on the bonds between atoms, barely changes (see modulus of elasticity of steel). The main factors are:
- Work hardening (cold working): plastic deformation multiplies dislocations, which block one another. 1020 goes from about 205 MPa hot-rolled to about 350 MPa cold-drawn; cold-rolled 304 stainless reaches 965 MPa or more in the full-hard condition of ASTM A666. The yield plateau usually disappears.
- Heat treatment: quenching forms martensite and tempering adjusts the trade-off between yield strength and toughness, as in 4140; annealing goes the opposite way and lowers yield strength.
- Grain size: grain boundaries block dislocations, and finer grain gives higher yield strength, a relationship described by Hall (1951) for mild steel.
- Temperature and strain rate: yield strength drops as temperature rises and increases with strain rate. Body-centered cubic steels are especially sensitive and can become brittle at low temperatures. That is why ISO 6892-1 controls the testing rate (method A, strain-rate control, and method B, stress-rate control) and why ISO 6892-2 exists for elevated-temperature testing. The values in the tables are at room temperature.
- Thickness: the product standard may lower the minimum for thick parts; A36 drops from 250 to 220 MPa for plate over 200 mm.
Worked examples
The five examples follow the order of the article: reading a test with a yield plateau, the 0.2% offset, acceptance of a rebar, sizing by allowable stress and the case for the extensometer.
Example 1: ReH, ReL, Rm and Re/Rm of a 1020 steel
Cylindrical test specimen of hot-rolled 1020 steel, d0 = 10.0 mm, tested on a dual-column universal testing machine. The software records FeH = 21.6 kN, FeL = 20.4 kN and Fm = 33.0 kN.
- Area: S0 = π × 10.0² / 4 = 78.54 mm².
- ReH = 21,600 / 78.54 = 275.0 MPa.
- ReL = 20,400 / 78.54 = 259.7 MPa, about 260 MPa.
- Rm = 33,000 / 78.54 = 420.2 MPa.
- ReL/Rm = 260 / 420 = 0.62.
The values are above the typical ones in the table (205 and 380 MPa), which is common: actual heats vary, and a typical value is not a limit.
Example 2: Rp0.2 by the offset method
Material without a yield plateau, with E = 200 GPa. Points on the curve: ε = 0.0035 at σ = 370 MPa; ε = 0.0040 at σ = 390 MPa; ε = 0.0050 at σ = 415 MPa.
- Offset line: σ = 200,000·(ε − 0.002).
- At ε = 0.0035 the line gives 300 MPa, below the curve (370); at ε = 0.0040 it gives 400 MPa, above the curve (390). The intersection lies between the two points.
- Curve interpolated between them: σ = 370 + 40,000·(ε − 0.0035). Setting them equal: 370 + 40,000ε − 140 = 200,000ε − 400, so 630 = 160,000ε and ε = 0.003938.
- Rp0.2 = 200,000 × 0.003938 − 400 = 387.5 MPa, about 388 MPa.
- Rt0.5: at a total extension of 0.5% (ε = 0.0050), the curve is at 415 MPa.
Example 3: checking a CA-50 bar
CA-50 bar with φ = 12.5 mm, nominal area π × 12.5² / 4 = 122.7 mm². In the test: yield force (upper) of 65.0 kN and maximum force of 76.5 kN.
- fy = 65,000 / 122.7 = 529.7 MPa, above 500 MPa.
- fst = 76,500 / 122.7 = 623.4 MPa.
- fst/fy = 623.4 / 529.7 = 1.18, above 1.10.
- Elongation (A ≥ 8% over 10φ or Agt ≥ 5%) and the bend test remain to be checked.
The bar meets both strength requirements. This does not prove the fyk of the lot, which is estimated statistically from several specimens.
Example 4: allowable stress of an A36 tie rod
A36 tie rod under a tensile force of 60 kN, with safety factor n = 2 (a teaching value; the actual factor comes from the design code).
- σadm = 250 / 2 = 125 MPa, based on the minimum yield strength.
- Minimum area: 60,000 / 125 = 480 mm².
- Diameter: d ≥ √(4 × 480 / π) = 24.7 mm, that is, a 25 mm bar.
Example 5: why the extensometer is essential
Steel with Re = 250 MPa and E = 200 GPa. The strain at yield is εy = 250 / 200,000 = 0.00125 (0.125%). Over a 50 mm gauge length, that is 0.0625 mm. Slack in the grips and the elastic deformation of the machine are of the same order or larger, so crosshead displacement cannot be used for Rp0.2 or for the modulus, which require an extensometer. ReH and ReL, on the other hand, depend only on force.
Yielding is not creep: a note on terminology
Translating the terms also causes errors. In Portugal, yielding is called "cedência" and yield strength "tensão de cedência" (in Brazil, "escoamento" and "limite de escoamento"). Creep ("fluência") is a different phenomenon: deformation that grows over time under constant load, usually at elevated temperature, measured in the creep test. Calling yield strength "limite de fluência" (literally "creep limit") mixes up two properties that are measured with different tests and enter design in different ways: yield strength limits the service stress at room temperature, and creep strength, which ASTM E6 defines as the stress that causes a specified creep strain in a specified time, limits a part that operates hot.
Yield strength standards
The definitions come from terminology and test method standards; the minimum values come from product standards. The table lists those cited in this article:
| Standard | Scope | Edition |
|---|---|---|
| ABNT NBR ISO 6892-1 | tensile testing of metals at room temperature (Brazilian adoption of ISO 6892-1): ReH, ReL, Rp, Rt, Rm | 2024 |
| ISO 6892-1 | tensile testing of metals at room temperature | 2019 |
| ISO 9513 | calibration of extensometers (class 1 for Rp and Rt) | 2012 |
| ASTM E8/E8M | tensile testing of metals, yield strength by the offset method | E8/E8M-25 |
| ASTM A370 | mechanical testing of steel products | A370-26 |
| ASTM E6 | terminology: elastic limit, proportional limit, yield strength, creep | E6-25 |
| ASTM A36/A36M | carbon structural steel | not specified |
| ASTM A572/A572M | high-strength low-alloy structural steel | not specified |
| ASTM A240/A240M | stainless steel plate and sheet | not specified |
| ABNT NBR 7480 | steel for reinforced concrete in Brazil (CA-25, CA-50, CA-60, CA-70) | 2024 |
Machine for measuring yield strength
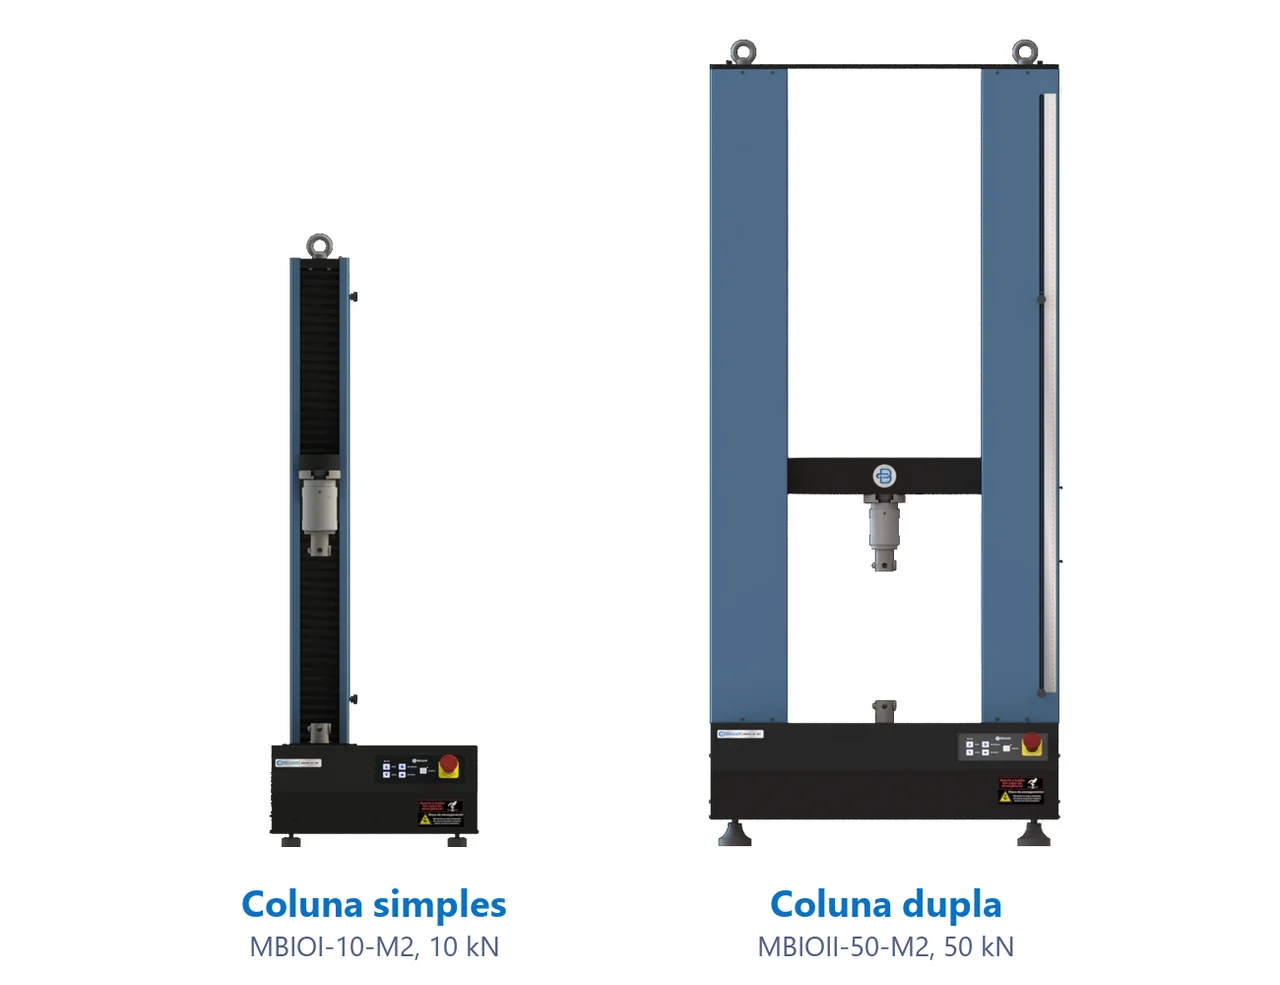
Yield strength is measured on a universal testing machine, and what the machine needs depends on which yield value you want. ReH and ReL depend only on force, so the requirement falls on the load cell: class 1 according to ISO 7500-1 (ABNT NBR ISO 7500-1:2023 in Brazil), which is the class required by the ISO 6892 series. Rp0.2 and Rt0.5 also require an extensometer on the test specimen, class 1 according to ISO 9513, for the reasons covered in exercise 5. The Biopdi M2 universal testing machine is electromechanical and meets both requirements: it comes in single-column models, from 200 N to 10 kN, and dual-column models, from 5 kN to 1,000 kN, with class 1 load cells, clip-on extensometers and the BioLab software, which plots the stress-strain curve and builds the report. The panel below shows the machine, the role of each part in measuring yield, and the grips used.
The universal testing machine in the tensile test
The M2 line includes single-column models, from 200 N to 10 kN, and dual-column models, from 5 kN to 1,000 kN. Each part of the machine has a role in measuring yield strength:
- Moving crosshead pulls the test specimen at the rate set by the standard, method A or B
- Load cell measures force, class 1: enough for ReH, ReL and Rm
- Grips wedge, pneumatic, for threaded specimens or wires
- Extensometer measures extension over the gauge length, required for Rp0.2 and Rt0.5
- BioLab software divides force by S0, plots the curve and builds the report
- Control panel and emergency stop position and stop the test
Fixtures for the tensile test
The fixtures below are mounted on the same machine, depending on the test specimen and the standard:
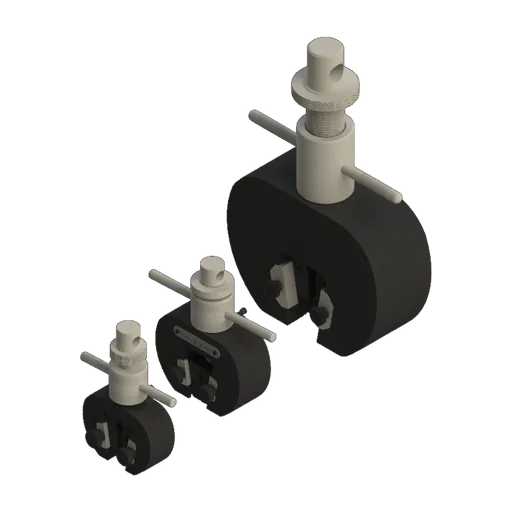 Wedge grip5, 20 and 200 kN
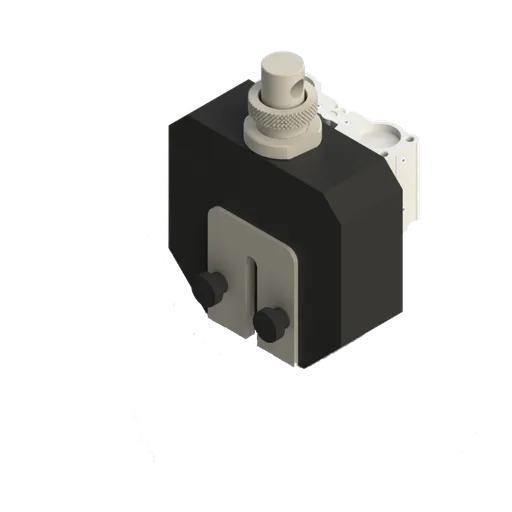 Pneumatic wedge grip50 and 200 kN
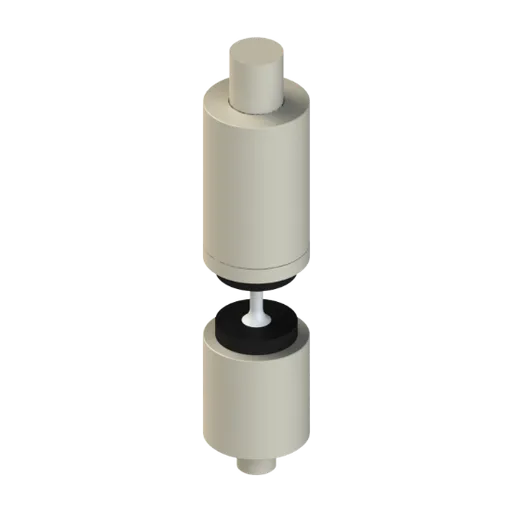 Grip for threaded specimensbolts and threaded test specimens
For machined steel test specimens, like the one in exercise 1, the 5 to 50 kN range is enough; for rebar like the one in exercise 3, the recommended model is the 100 to 200 kN universal testing machine (MBIOII-200-M2). The BioLab software runs on Windows, connects via USB or serial and does not need an internet connection. The other capacities are on the universal testing machine page.
Other tests and technical references
Ultimate tensile strength (Rm): what it is, formula, graph, steel table and how to measure it
Ultimate tensile strength (Rm) is the engineering stress at the maximum force of the tensile test: Rm = Fm/S0. See the symbols, where it sits on the graph, how it differs from yield strength and fracture stress, the steel table with material condition, CA-50 (Brazilian rebar grade), breaking load, the estimate from hardness, and exercises.
Elastic and plastic deformation: what elastic deformation is, formula, difference and examples
Elastic deformation is the reversible deformation of a solid: the bonds between atoms stretch without breaking, and the part returns to its original size when the load is removed. See the formula ε = σ/E, where elastic deformation ends, how it differs from plastic deformation, how much each material deforms, resilience, elastic recovery, rubber and solved exercises.
Proportional limit: what it is, how it differs from the elastic limit and yield strength, and how to measure it
In strength of materials, the proportional limit is the highest stress at which stress and strain are still proportional: the end of the straight portion of the curve and of Hooke's law. See the ASTM E6 definition, how it differs from the elastic limit and Rp0.2, how to measure it with an extensometer, and worked examples.
Plastic deformation: what it is, mechanism, formulas, metal forming and exercises
Plastic deformation is the permanent change of shape that remains in a material after the load is removed. In metals it begins at the yield strength and occurs through the movement of dislocations. See the mechanism, the formulas (εp = ε − σ/E and true strain), cold and hot working, how to measure it in a tensile test, and solved exercises.
Frequently asked questions
What is the elastic limit?
It is the highest stress a material can withstand without permanent deformation after unloading (ASTM E6). In practice it is measured by a small, conventional residual strain, such as 0.01% or 0.05%, because the exact value depends on the sensitivity of the equipment.
What is yield strength?
It is the stress at which the material begins to deform plastically to a measurable extent. Low-carbon steel shows an upper yield strength (ReH) and a lower yield strength (ReL); materials without a yield plateau use the offset yield strength Rp0.2, which corresponds to 0.2% plastic extension (ISO 6892-1:2019).
Are the elastic limit and yield strength the same thing?
No, but in metals the two are so close that engineering uses yield strength in place of the elastic limit, because it is measurable and reproducible. Product standards such as ASTM A36, ABNT NBR 7480 (the Brazilian standard for steel reinforcing bars) and ASTM A240 specify yield strength, not the elastic limit.
Is the elastic limit the same as the proportional limit?
No. The proportional limit is the end of the linear relationship between stress and strain; the elastic limit is the end of reversible behavior. The first is equal to or lower than the second, and both lie below the offset yield strength.
What is the formula for yield strength?
Re = Fe/S0: the force at yield divided by the original cross-sectional area, in MPa (N/mm²). Example: 20.4 kN on a test specimen 10 mm in diameter (78.54 mm²) gives about 260 MPa.
What is the symbol for yield strength?
In ISO 6892-1: Re, ReH, ReL, Rp0.2 and Rt0.5. In textbooks: σy, σe or Sy. In reinforced concrete (ABNT NBR 7480 and NBR 6118, the Brazilian standards for reinforcing steel and concrete structure design): fy and fyk.
How do you find Rp0.2 on the graph?
Draw a line parallel to the elastic portion starting at 0.2% strain on the horizontal axis. The stress where this line crosses the curve is Rp0.2. Strain must be measured with an extensometer, at least class 1 according to ISO 9513.
What is the yield strength of A36 steel?
The minimum is 250 MPa (36 ksi) for plates, shapes and bars up to 200 mm, and 220 MPa for thicker plates, with a tensile strength of 400 to 550 MPa (ASTM A36). Mill certificates typically show 280 to 340 MPa.
What is the yield strength of CA-50 steel?
CA-50 is a Brazilian reinforcing bar grade. Its characteristic yield strength fyk is 500 MPa, with a tensile strength of at least 1.10 fy and an elongation of 8% over 10 diameters or an Agt of 5% (ABNT NBR 7480:2024). The fyk applies to the lot and is estimated statistically.
What is the yield strength of 1045 steel?
About 310 MPa hot-rolled and about 530 MPa cold-drawn, for bars from 19 to 32 mm. Annealed, it is close to 240 MPa; quenched and tempered, it can be much higher.
What is the yield strength of 4140 steel?
It depends on the heat treatment: about 415 MPa annealed and 655 to 1,640 MPa quenched and tempered. The lower the tempering temperature, the higher the yield strength and the lower the toughness.
Is yielding the same as creep?
No. Creep is deformation that increases over time under constant load, usually at elevated temperature, and it has its own test. Yielding is the onset of plastic deformation in the tensile test; in Portugal it is called "cedência".