
Work hardening is the metallurgical phenomenon in which a metal becomes harder and stronger after cold plastic deformation. Deformation multiplies dislocations, linear defects in the crystal, which then start to block one another; as a result the yield strength, the ultimate tensile strength and the hardness go up, and ductility goes down. The modulus of elasticity does not change.
Work hardening is quantified by the percent cold work (%CW), the percentage reduction in area the part has undergone, and by the strain hardening exponent n of the Hollomon equation, measured in a tensile test according to ISO 10275:2020 or ASTM E646-16(2024). This article goes from the mechanism to measurement, annealing and worked examples.
What is work hardening
Above the yield strength, part of a metal's deformation can no longer be recovered: this is plastic deformation. In ductile metals, the more the metal is deformed, the more stress is needed to deform it a little further. This increase in resistance to plastic deformation, caused by the deformation itself, is work hardening, also called strain hardening or cold working (Callister and Rethwisch, Materials Science and Engineering: An Introduction, ch. 7).
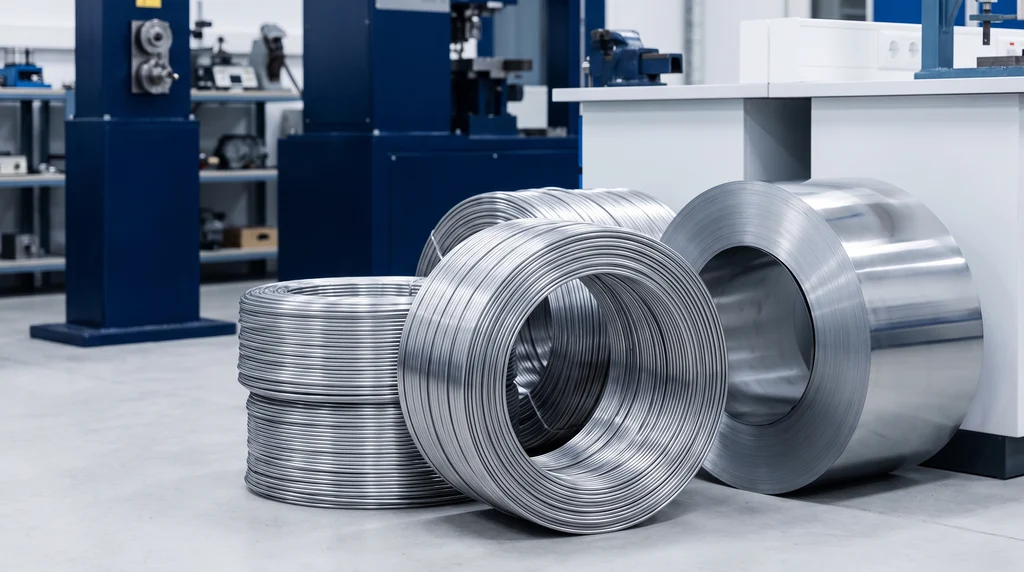
The photo shows coils of cold-drawn steel wire and a coil of cold-rolled strip: wire drawing and cold rolling are the processes in which work hardening increases the strength of the product.
The "cold" in the name does not refer to room temperature, but to the metal's recrystallization temperature, the temperature at which it forms new grains and loses its work hardening (covered in the section on annealing). Deforming below it is cold working, and work hardening accumulates; deforming above it is hot working, and work hardening is removed as it forms. For lead and tin, which recrystallize near room temperature (Callister, Table 7.2), deforming at 20 °C is already hot working, which is why they practically do not work harden in service.
A paper clip bent several times at the same spot gets harder with each bend and eventually cracks. In industry the effect is used on purpose. Hot-rolled AISI 1020 steel has a typical yield strength of 205 MPa, Rm of 380 MPa and elongation of 25%; cold drawn, it reaches 350 MPa yield strength and 420 MPa Rm, with elongation of about 15% (typical values from the ASM table). Yield strength rose 71%, tensile strength 11%, and ductility fell: this is the trade-off every work hardening makes. On the stress-strain curve, work hardening is the portion between the end of yielding and the ultimate tensile strength, where the curve rises because the metal hardens as it deforms.
Why the metal hardens: the role of dislocations
A real metal crystal contains dislocations, linear defects in which a row of atoms is out of place. Plastic deformation of metals takes place by slip, the sliding of atomic planes, and it does not happen all at once: it advances through the movement of dislocations, which break and re-form only a few bonds at a time. The theory was proposed independently in 1934 by G. I. Taylor, E. Orowan and M. Polanyi.
Work hardening arises from slip itself: dislocations multiply as they move. New ones come from existing ones, from grain boundaries and from surface irregularities, and the average distance between them decreases. Each one distorts the lattice around it, and these strain fields repel, cross and tangle with each other. Moving a dislocation through the tangle requires more stress, which is why the yield strength rises as the metal deforms.
The table below gives the order of magnitude, as dislocation length per unit volume (Callister and Rethwisch): heavy deformation multiplies the density by a million or more, and heat treatment removes much of it.
| Condition of the metal | Density (mm⁻²) | Density (cm⁻²) |
|---|---|---|
| Carefully solidified crystal | about 10³ | about 10⁵ |
| Heavily deformed metal | 10⁹ to 10¹⁰ | 10¹¹ to 10¹² |
| Deformed and then heat-treated metal | 10⁵ to 10⁶ | 10⁷ to 10⁸ |
Work hardening is one of the four classic strengthening mechanisms of metals, all based on hindering dislocation motion; the others are grain size reduction, solid solution strengthening and precipitation hardening. What sets it apart is that it only requires deforming the part, without changing its composition or heating it. It should also not be confused with quenching, which hardens steel by rapid cooling and martensite formation. An overview of the properties is given in mechanical properties of materials.
The mechanism also explains why work hardening is a phenomenon of metals. In ceramics, dislocations practically do not move at room temperature, and they fracture without plastic deformation. Polymers do harden under large deformation, but by another mechanism: the orientation of the molecular chains.
What work hardening changes in the properties
Work hardening raises all the properties related to the onset and continuation of plastic deformation. The yield strength rises the most, because it is precisely the stress needed to move dislocations. The ultimate tensile strength also rises, in a smaller proportion, as in cold-drawn 1020. Hardness, which is resistance to localized plastic deformation, follows the yield strength. In low-carbon steel, the yield point plateau usually disappears.
The price is ductility. Elongation and reduction of area drop, because the metal has already used up part of the plastic deformation it could withstand before fracture, and tensile toughness drops when this loss outweighs the gain in strength. A heavily work-hardened metal cannot be formed further without cracking.
What does not change is the modulus of elasticity. The modulus depends on the bonds between atoms, and work hardening only changes the number of defects. That is why it is wrong to say that a work-hardened metal becomes "stiffer": it becomes stronger and harder, with the same stiffness. To a lesser extent, electrical resistivity rises slightly, and the metal stores strain energy and residual stresses. This energy is the driving force for recrystallization, and it is the residual stresses, not the loss of ductility, that can promote stress corrosion cracking. The table summarizes the effects:
| Property | Effect of work hardening | Reason |
|---|---|---|
| Yield strength (Re, Rp0.2) | rises sharply | more stress to move tangled dislocations |
| Ultimate tensile strength (Rm) | rises | same mechanism, in a smaller proportion |
| Hardness | rises | resistance to localized plastic deformation |
| Elongation and reduction of area | drop | part of the capacity to deform has already been used |
| Modulus of elasticity E | does not change | depends on atomic bonds, not on defects |
| Electrical resistivity | rises slightly | dislocations scatter electrons |
| Stored energy and residual stresses | rise | lattice distortion around dislocations |
Work hardening seen in the tensile test: unloading and reloading
The tensile test shows work hardening directly. Unloaded partway through the plastic region, the test specimen goes down along a straight line parallel to the elastic portion, with the same slope E, and is left with permanent strain. Reloaded, it goes up along the same line and only yields again at the stress at which it was unloaded.
The graph below shows this for an annealed low-carbon steel. The curve was calculated in true stress and true strain using the Hollomon equation, with K = 600 MPa and n = 0.21 from Callister; both are explained in the section on the Hollomon equation, and here it is enough to read the shape of the curve. The annealed metal yields at about 163 MPa. Unloaded at 10% plastic strain, at 370 MPa, it keeps 10% permanent elongation and, on reloading, only yields again at 370 MPa: the yield strength more than doubled, and the unloading line parallel to the elastic portion shows that the modulus did not change.
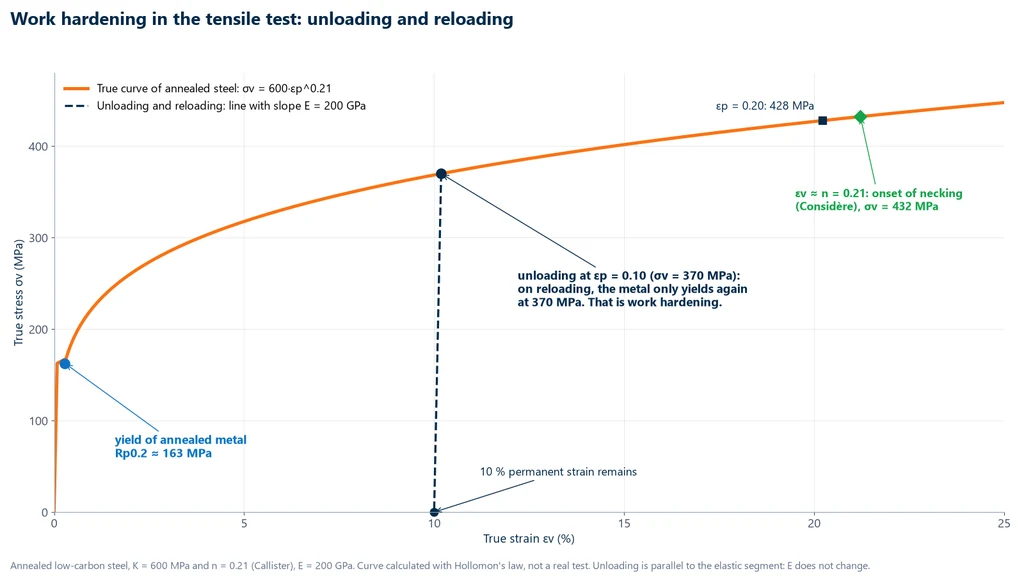
In a cold-formed part, rolling or drawing plays the role of the first loading, and the finished part yields at the level where forming stopped. One caveat: metal work hardened in tension yields at a lower stress if the load is reversed into compression. This is the Bauschinger effect, which matters under alternating loading.
Percent cold work (%CW)
In industry, the amount of work hardening in a formed part is expressed as the percent cold work, the percentage reduction in cross-sectional area:
- General formula: %CW = (A0 − Ad) / A0 × 100, where A0 is the original area and Ad the area after deformation (Callister, Eq. 7.8).
- Round bar or wire: %CW = (d0² − dd²) / d0² × 100, because area is proportional to the square of the diameter.
- Rolled sheet with constant width: %CW = (t0 − td) / t0 × 100, because area is proportional to thickness.
The most common mistake is applying the formula to the diameters: a bar drawn from 15.2 to 12.2 mm has 35.6 %CW, while the calculation with diameters would give 19.7% (example 1).
For each alloy, curves obtained from testing relate %CW to the properties: yield strength and Rm rise, and elongation drops quickly in the very first degrees of cold work. Callister and Rethwisch present them for 1040 steel, brass and copper (Fig. 7.19); copper with 35.6 %CW reaches an Rm of about 340 MPa and an elongation of about 7%. It is through these curves that %CW specifies the delivery condition of a cold-worked product.
Hollomon equation and the strain hardening exponent n
The %CW tells you how much a part has been deformed. It does not tell you how much the material hardens with each increment of strain. That is a material property, the strain hardening exponent n, and you get it from the tensile test curve.
True stress and true strain
The Hollomon equation uses the true curve. The true stress σv is the force divided by the instantaneous area, and the true strain εv = ln(L / L0) adds up each elongation increment divided by the length at that instant. Plastic deformation does not change volume, so while the strain is uniform both values can be calculated from the engineering curve: σv = R·(1 + e) and εv = ln(1 + e), where R is the engineering stress and e is the engineering strain. These conversions are valid only up to maximum force, where necking begins. The two curves are compared in the article on the stress-strain curve.
The Hollomon equation
In 1945, J. H. Hollomon ("Tensile Deformation", Transactions of the AIME, vol. 162, pp. 268-290) proposed describing the uniform plastic portion of the true curve as σv = K·εvn. This simplified the power law that Ludwik had published in 1909. Both parameters have a physical meaning:
- n, strain hardening exponent: dimensionless, between 0 and 1. With n = 0 the material would yield without hardening. With n = 1, stress would rise in proportion to strain. Most metals fall between 0.10 and 0.50, and the higher the n, the more the metal hardens as it deforms.
- K, strength coefficient: in MPa, the true stress the equation predicts at εv = 1. The test never reaches that point; K indicates the strength level of the curve.
Taking logarithms turns the equation into a straight line with slope n: ln σv = ln K + n·ln εv. The standards use this form to measure n, and two points on the true curve are enough to estimate the exponent: n = ln(σ2/σ1) / ln(ε2/ε1). The table summarizes these formulas together with the one for %CW:
| Quantity | Formula | Note |
|---|---|---|
| Percent cold work | %CW = (A0 − Ad) / A0 × 100 | use areas, not diameters |
| True stress | σv = R·(1 + e) | valid up to maximum force |
| True strain | εv = ln(1 + e) | valid up to maximum force |
| Hollomon equation | σv = K·εvn | K in MPa, n dimensionless |
| Logarithmic form | ln σv = ln K + n·ln εv | n is the slope of the line |
| n from two points | n = ln(σ2/σ1) / ln(ε2/ε1) | points in the uniform regime |
Values of n and K by material
Both n and K depend on the material and its condition. The table gives the values from Callister (Fundamentals of Materials Science and Engineering, 2nd ed., 2005):
| Material | Condition | n | K (MPa) |
|---|---|---|---|
| Low-carbon steel | annealed | 0.21 | 600 |
| 4340 alloy steel | tempered at 315 °C | 0.12 | 2,650 |
| 304 stainless steel | annealed | 0.43 to 0.45 | 1,400 |
| Copper | annealed | 0.44 | 530 |
| Naval brass | annealed | 0.21 | 585 |
| 2024 aluminum alloy | T3 | 0.17 | 780 |
| AZ31B magnesium alloy | annealed | 0.16 | 450 |
The chart below plots four of these materials on a log-log scale. Each line has the slope of its n, the square at εv = 1 marks K, the circle marks the end of the uniform regime (Considère criterion, below), and the green band is the 10% to 20% fitting range used in the measurement. It also clears up a common confusion: annealed copper has the highest n and the lowest stress on the chart. The n tells you how much strength the metal gains as it deforms, while the stress level comes from K. Tempered 4340 steel has the lowest n and is the strongest.
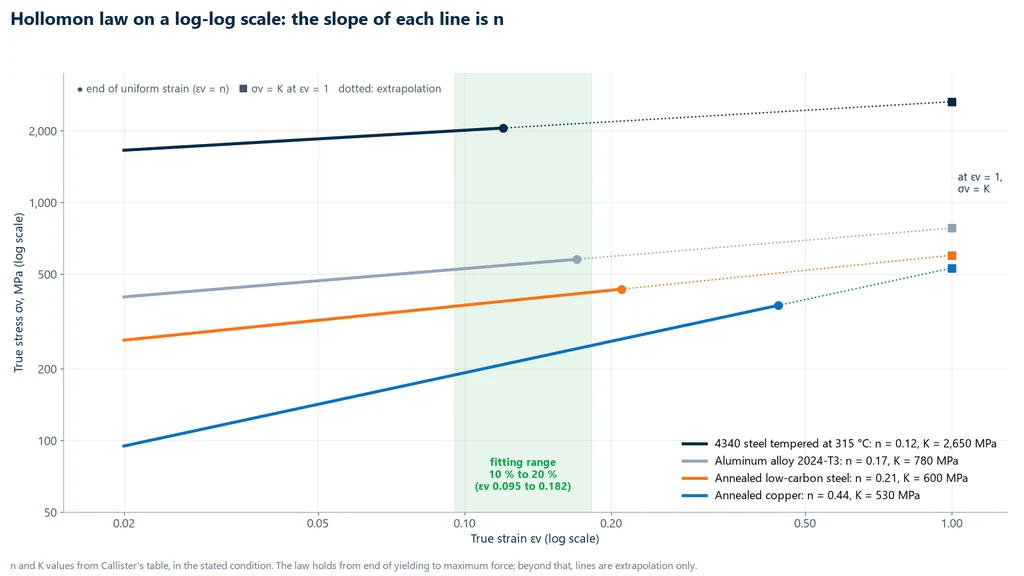
Other compilations give different numbers. A table that combines Kalpakjian and the ASM Handbook lists n = 0.26 and K = 530 MPa for annealed low-carbon steel, n = 0.54 for annealed copper and n = 0.45 for annealed 304 stainless steel (for stainless, the Callister editions range from 0.43 to 0.45). These are not errors. n and K depend on composition, grain size, the fitting range, and whether total or plastic strain is used, so they can only be compared when the condition and range are stated. The same compilation shows the point that matters most for forming: cold-worked low-carbon steel has an n of about 0.08, compared with 0.26 when annealed. A work-hardened metal has already used up much of its capacity to harden. There is also a pattern by crystal structure: annealed face-centered cubic metals such as copper, brass and 304 stainless have a high n and harden a lot.
n and necking: the Considère criterion
According to the Considère criterion (1885), necking begins when strain hardening can no longer compensate for the loss of area, that is, when dσv/dεv = σv. Applied to the Hollomon equation, the criterion gives εu = n: the uniform true strain equals the strain hardening exponent. The annealed steel in the first chart, with n = 0.21, begins to neck at εv ≈ 0.21, which corresponds to about 23% engineering strain.
In sheet metal, a high n means that strain spreads out instead of concentrating at one spot, which makes it the most closely watched number in stamping. ASTM E646 states that the n-value is used to estimate the strain at the onset of necking and to compare the stretch formability of similar metals. In deep drawing, another coefficient matters more: the plastic strain ratio r (ISO 10113). Both are covered in the article on the cupping test.
How to measure the n exponent: ISO 10275 and ASTM E646
n is measured in an ordinary tensile test, recorded accurately over the uniform plastic portion. The standards are ISO 10275:2020, for metallic sheet and strip, and ASTM E646-16(2024), for sheet from 0.13 to 6.4 mm thick (other product forms only by agreement). The procedure has these steps:
- Prepare the test: sheet specimen according to ISO 6892-1 or ASTM E8/E8M, tested between 10 °C and 35 °C (ISO 10275).
- Ensure the measurement: ISO 10275 requires a machine with class 1 force or better (ISO 7500-1) and an extensometer of class 2 or better (ISO 9513), class 1 if the r-value is measured in the same test. Crosshead displacement cannot be used, because it includes grip slack and machine deflection.
- Control the speed: in the plastic range, the strain rate must not exceed 0.008 s⁻¹ (ISO 10275).
- Convert the curve: convert force and elongation into true stress and true strain. In the 2020 edition of ISO 10275, n is the exponent of the true plastic strain, εp: the elastic part is subtracted from the total. The 2007 edition allowed skipping the subtraction when the elastic part was less than 10% of the total.
- Choose the range: only the continuous, uniform plastic portion counts, after the end of the yield point elongation, if any, and before maximum force. Note 4 of ASTM E646 records that the 10% to 20% engineering strain range is often used for low-carbon drawing-quality steels.
- Fit and report: run a linear regression of ln σv against ln εp over the chosen range; the slope is n. Report the result with its range, for example n10-20 = 0.22.
A single power law may not describe the whole curve: ASTM E646 allows reporting more than one n, and there are other models, such as Ludwik, Swift and Voce. Aluminum-magnesium alloys with serrated yielding (Portevin-Le Chatelier effect) call for the automatic regression method of ISO 10275. Exercise 4 works through the full calculation.
Work hardening and annealing: recovery, recrystallization and grain growth
Work hardening is permanent at room temperature, but a heat treatment reverses it. When heated, the metal releases the energy stored in its dislocations in three stages, which together make up annealing (Callister, sections 7.11 to 7.13):
- Recovery: as heat activates atomic diffusion, some dislocations rearrange into lower-energy configurations and some annihilate. Internal stresses and electrical resistivity drop, but mechanical strength drops only slightly.
- Recrystallization: new equiaxed grains with few dislocations form and consume the deformed metal. Strength and ductility return to their values before cold work.
- Grain growth: if heating continues after recrystallization, the larger grains grow at the expense of the smaller ones, and strength drops a little further because of the grain size effect.
Recrystallization is therefore not an alternative to annealing: it is the stage of annealing that removes work hardening. The stages are confirmed by metallography, with a cutting machine, a grinding and polishing machine and a metallurgical microscope. For an overview of the treatments, see heat treatment of metals.
Recrystallization temperature
The recrystallization temperature is the temperature at which recrystallization is complete in 1 hour, typically between 1/3 and 1/2 of the absolute melting temperature, that is, 0.3 to 0.5 Tf in kelvin (Callister). It is not a constant of the metal: it falls as %CW increases, because more energy is stored, and it rises with impurities and alloying elements. The table gives the values from Callister and Rethwisch (Table 7.2) and the ratio in kelvin:
| Metal or alloy | Recrystallization, 1 h (°C) | Melting (°C) | Ratio in kelvin |
|---|---|---|---|
| Aluminum (99.999%) | 80 | 660 | 0.38 |
| Copper (99.999%) | 120 | 1,085 | 0.29 |
| Brass (60Cu-40Zn) | 475 | melts over a range | not calculated |
| Nickel (99.99%) | 370 | 1,455 | 0.37 |
| Iron | 450 | 1,538 | 0.40 |
The brass row shows the effect of alloying: pure copper recrystallizes at 120 °C, and adding 40% zinc raises that temperature to 475 °C.
Cold working and hot working
Choosing between the two forming routes defined at the start of the article is a process decision. Cold working gives the part strength, surface finish and dimensional accuracy, but ductility runs out and the reduction per pass is limited. In hot working, recrystallization happens during deformation (dynamic recrystallization), so the metal accepts large reductions with lower forces. That is why there is no such thing as "hot work hardening": the correct term is hot working, or hot forming. Rolling, forging and extrusion can be done either way.
Work hardening in industry
Work hardening is both a resource and a limit of cold forming. The most common applications are these:
- Wire and bar drawing: dies of decreasing diameter raise the yield strength, as in cold-drawn 1020 steel.
- Cold rolling of sheet and strip: gives precise thickness and the specified strength; beverage can sheet is cold rolled.
- Stamping: the most deformed regions come out stronger, and a high n prevents localized necking.
- Intermediate annealing: when the total reduction would use up all the ductility, the process is split into stages with annealing between them.
- Surface hardening by deformation: shot peening and deep rolling work-harden only the surface and leave compressive residual stresses there.
Work hardening also shows up where it was not planned: every cold bend work-hardens the bent region, and the bend test checks whether the material can take that deformation without cracking.
Solved exercises
The five exercises follow the order of the article, from %TF (percent cold work) to the recrystallization temperature.
Exercise 1: percent cold work of a copper bar
A copper bar 15.2 mm in diameter is cold drawn to 12.2 mm. Calculate the %TF.
- Since the area is proportional to d², the squares are enough: d0² = 15.2² = 231.04 and dd² = 12.2² = 148.84.
- %TF = (231.04 − 148.84) / 231.04 × 100 = 82.20 / 231.04 × 100 = 35.6 %.
- From Callister's curves (Fig. 7.19), copper at this %TF has an Rm of about 340 MPa and an elongation of about 7 %.
- Wrong calculation, using diameters: (15.2 − 12.2) / 15.2 = 19.7 %.
Exercise 2: true stress from the Hollomon equation
Annealed low-carbon steel, K = 600 MPa and n = 0.21 (Callister). Calculate σv at εv = 0.10 and 0.20 and compare with the yield strength of the annealed metal.
- εv = 0.10: 0.100.21 = e0.21 × ln 0.10 = e−0.4835 = 0.6166, so σv = 600 × 0.6166 = 370 MPa.
- εv = 0.20: 0.200.21 = e−0.3380 = 0.7132, so σv = 428 MPa. Doubling the strain raises the stress by about 16 %.
- Yield strength of the annealed metal, at 0.2 % plastic strain: 600 × 0.0020.21 = 163 MPa. A part strained to 0.10 and unloaded now yields at 370 MPa, 2.3 times that value, as in the first chart.
Exercise 3: n and K from two points
On the true stress-strain curve of a metal: σ1 = 400 MPa at ε1 = 0.05 and σ2 = 520 MPa at ε2 = 0.20. Calculate n and K.
- n = ln(520/400) / ln(0.20/0.05) = ln 1.30 / ln 4 = 0.2624 / 1.3863 = 0.19.
- K = σ1 / ε1n = 400 / 0.050.1893 = 400 / 0.5672 = 705 MPa.
- Check: 705 × 0.200.1893 = 705 × 0.7374 = 520 MPa.
Exercise 4: n of a sheet tested with an extensometer
Sheet test specimen with a 12.5 mm × 1.0 mm cross section (S0 = 12.5 mm²) and an extensometer with L0 = 50 mm. The load cell records F = 4.00 kN at ΔL = 5.0 mm (e = 0.10) and F = 4.40 kN at ΔL = 10.0 mm (e = 0.20). Take E = 200 GPa. Calculate n, K and the uniform strain.
- Engineering stresses: R1 = 4,000 / 12.5 = 320 MPa; R2 = 4,400 / 12.5 = 352 MPa.
- True stresses: σ1 = 320 × 1.10 = 352.0 MPa; σ2 = 352 × 1.20 = 422.4 MPa.
- Plastic component, subtracting the elastic part R/E: ep1 = 0.10 − 320/200,000 = 0.0984; ep2 = 0.20 − 352/200,000 = 0.1982.
- True plastic strains: εp1 = ln 1.0984 = 0.0939; εp2 = ln 1.1982 = 0.1809.
- n = ln(422.4/352.0) / ln(0.1809/0.0939) = 0.1823 / 0.6559 = 0.28. Without subtracting the elastic part, the result would be 0.281: the correction has little weight here, but it is what ISO 10275:2020 requires.
- K = 352.0 / 0.09390.278 ≈ 679 MPa.
- Considère criterion: εu ≈ n = 0.28, which corresponds to a uniform engineering strain of e0.28 − 1 ≈ 32 %.
The data are for teaching purposes: in a real test the regression uses all points between 10 % and 20 %, and the result is reported as n10-20.
Exercise 5: estimating the recrystallization temperature
Estimate the recrystallization temperature of iron and copper with the 0.3 to 0.5 Tf rule and compare with the table.
- Iron: Tf = 1,538 °C = 1,811 K. With 0.4·Tf: 0.4 × 1,811 = 724 K = 451 °C, practically the 450 °C in the table.
- Copper: Tf = 1,085 °C = 1,358 K. The 0.3 to 0.5·Tf range gives 407 to 679 K, or 134 to 406 °C.
- The table gives 120 °C for 99.999 % copper, below the range: very pure metal recrystallizes below the general rule, because it is the impurities that raise this temperature.
Standards for work hardening and the n exponent
The n exponent has its own test method standards, which rely on the tensile testing standards and on the calibration standards for the instruments. The table lists those cited in this article:
| Standard | Scope | Edition |
|---|---|---|
| ISO 10275 | tensile strain hardening exponent n of metallic sheet and strip | 2020 |
| ASTM E646 | n value of metallic sheet from 0.13 to 6.4 mm thick | E646-16(2024) |
| ABNT NBR ISO 6892-1 | tensile testing of metals at room temperature (Brazilian adoption of ISO 6892-1) | 2024 |
| ISO 6892-1 | tensile testing of metals at room temperature | 2019 |
| ASTM E8/E8M | tension testing of metallic materials | E8/E8M-25 |
| ISO 9513 | calibration of extensometers (class 2 or better for n) | 2012 |
| ABNT NBR ISO 7500-1 | verification of the testing machine force (class 1 for n; Brazilian adoption of ISO 7500-1) | 2023 |
| ISO 10113 | plastic strain ratio r of sheet | not specified |
Testing machine to measure work hardening and the n exponent
Measuring n requires continuously recording, at a controlled rate, the force, with a class 1 load cell, and the elongation, with an extensometer attached to the gauge length. The Biopdi M2 universal testing machine is electromechanical and meets these requirements: it comes in models from 200 N to 1,000 kN, with class 1 load cells, clip-on extensometers and the BioLab software, which plots the curve and builds the report. The panel below shows the machine, the role of each part in measuring work hardening, and the grips used.
The universal testing machine in the tensile test
The M2 line has single-column models, from 200 N to 10 kN, and dual-column models, from 5 kN to 1,000 kN. Each part of the machine has a function in measuring work hardening and n:
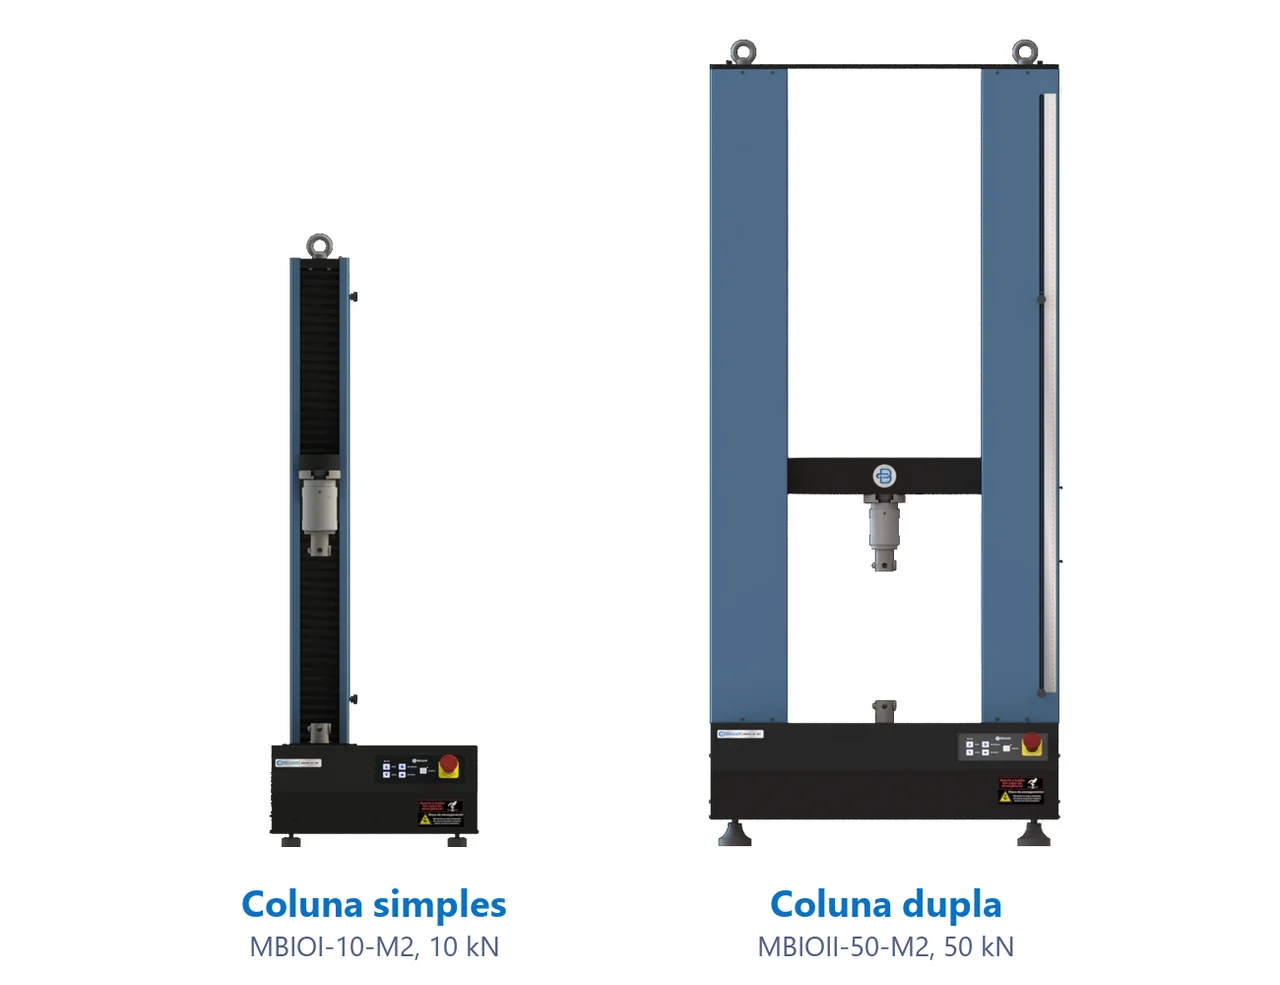
- Moving crosshead pulls the test specimen at the strain rate set by the standard
- Load cell measures the force F, class 1
- Grips: wedge, pneumatic, for threaded specimens or for wires
- Extensometer measures ΔL over the gauge length L0, from yielding to maximum force
- BioLab software divides by S0 and L0, plots the curve and builds the report
- Control panel and emergency stop position and stop the test
Fixtures for the tensile test
The fixtures below are mounted on the same machine, depending on the test specimen and the standard:
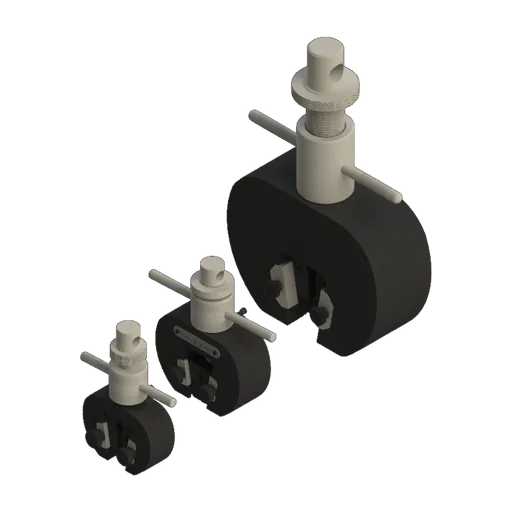 Wedge grip5, 20 and 200 kN
 Pneumatic wedge grip50 and 200 kN
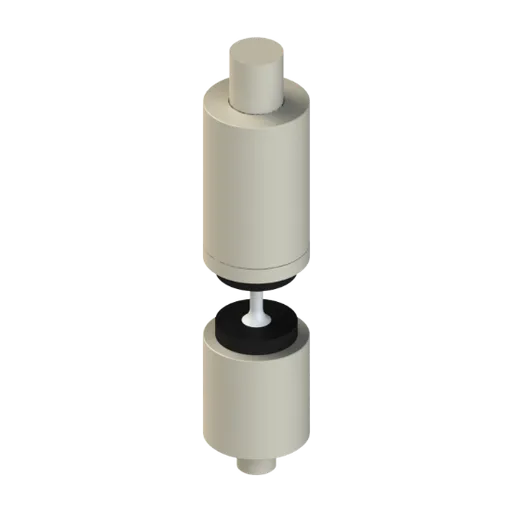 Grip for threaded specimensbolts and threaded test specimens
For metal sheet like the one in exercise 4, the recommended range is the 5 to 50 kN universal testing machine (MBIOII-50-M2), a dual-column model built for metals, sheet, composites and fasteners. For cold-worked rebar, profiles and cables, the model is the 100 to 200 kN universal testing machine (MBIOII-200-M2). In the BioLab software, custom calculation formulas let you create your own quantities from force, position and extensometer readings, such as true stress and true strain up to Rm, which are the basis for calculating n. The other capacities are on the universal testing machine page.
Other tests and technical references
Plastic deformation: what it is, mechanism, formulas, metal forming and exercises
Plastic deformation is the permanent change of shape that remains in a material after the load is removed. In metals it begins at the yield strength and occurs through the movement of dislocations. See the mechanism, the formulas (εp = ε − σ/E and true strain), cold and hot working, how to measure it in a tensile test, and solved exercises.
Hardness of materials: what it is, scales and HRC, HB and HV conversion chart
Hardness is a material's resistance to localized plastic deformation. Types, scales, HRC × HB × HV chart, what 60 HRC means and steel hardness.
Elastic limit and yield strength: what they are, the difference, formula, Rp0.2 and steel table
The elastic limit is the highest stress without permanent strain; yield strength is where plastic strain becomes measurable (ReH and ReL, or Rp0.2). See the formula, symbols, 0.2% offset, steel table, CA-50 and exercises.
Proportional limit: what it is, how it differs from the elastic limit and yield strength, and how to measure it
In strength of materials, the proportional limit is the highest stress at which stress and strain are still proportional: the end of the straight portion of the curve and of Hooke's law. See the ASTM E6 definition, how it differs from the elastic limit and Rp0.2, how to measure it with an extensometer, and worked examples.
Frequently asked questions
What best defines work hardening?
It is the increase in strength and hardness of a metal when it is plastically deformed below its recrystallization temperature. Deformation multiplies dislocations, which begin to block one another; the yield strength rises and ductility drops (Callister and Rethwisch).
What is a work-hardened steel?
It is a steel that has been cold worked, by rolling, drawing or bending, so that its yield strength and hardness have risen and its elongation has dropped compared with the annealed or hot-rolled condition. Cold-drawn 1020 steel, for example, yields at about 350 MPa, versus 205 MPa hot rolled, and elongates about 15 % instead of 25 %.
What is the Hollomon equation?
σv = K·εv^n: true stress equals the strength coefficient K, in MPa, times true strain raised to the strain hardening exponent n. It was published by J. H. Hollomon in 1945 and applies from the end of yielding up to maximum force.
What is the strain hardening exponent n?
It is the exponent of the Hollomon equation, a dimensionless number between 0 and 1 that measures how much the metal hardens as it deforms. For metals it is usually between 0.10 and 0.50: about 0.21 for annealed low-carbon steel and 0.44 for annealed copper, according to Callister's values.
How is the n exponent measured?
With a tensile test on sheet, using an extensometer, according to ISO 10275:2020 or ASTM E646-16(2024). The data are converted to true stress and true strain, and n is the slope of the ln σ versus ln ε line in the uniform deformation range. For low-carbon drawing-quality steel, the 10 % to 20 % range is the most widely used.
What is the relationship between n and necking?
By the Considère criterion, in a material that follows the Hollomon equation the true uniform strain equals n. A sheet with n = 0.28 deforms uniformly up to about 32 % engineering strain before a neck forms.
How is the degree of work hardening calculated?
With the percent cold work, %TF = (A0 − Ad)/A0 × 100, using the cross-sectional areas before and after deformation. A bar drawn from 15.2 to 12.2 mm in diameter has 35.6 %TF.
Does work hardening change the modulus of elasticity?
No. The modulus depends on the bonds between atoms and hardly changes with cold work. What changes is the stress at which the metal starts to yield.
What is the annealing process?
The work-hardened metal is heated above its recrystallization temperature, usually between 1/3 and 1/2 of the absolute melting temperature, and goes through recovery (stress relief), recrystallization (new grains) and, if heating continues, grain growth. In iron, recrystallization is complete in 1 hour at about 450 °C (Callister).
Is work hardening reversible?
At room temperature it is permanent, but annealing removes it: recrystallization restores the strength and ductility the metal had before cold working. In industry, this is done between drawing or rolling passes when the total reduction is large.
What is the difference between cold working and hot working?
In cold working, deformation takes place below the recrystallization temperature and work hardening accumulates. In hot working it takes place above it: work hardening is undone during deformation, and the metal stays ductile and accepts large reductions.
Does work hardening occur in polymers and ceramics?
Not in the same sense. Ceramics hardly deform plastically at room temperature. Polymers can harden under large deformation, but through the orientation of their molecular chains, which is a different mechanism.