
Necking is the localized reduction of the specimen's cross-section that begins at the maximum force of a tensile test, when the material's work hardening can no longer make up for the loss of area. Until that point, deformation is spread over the whole parallel length. From then on it concentrates in a short region, which thins out into a neck, and that is where the specimen fractures. In Brazilian Portuguese the phenomenon is called estricção, and also empescoçamento or formação de pescoço, which are translations of the English term necking. Necking is measured after fracture by the percentage reduction of area, Z = (S0 − Su) / S0 × 100. Here S0 is the original cross-sectional area and Su is the minimum area at the neck, as defined in ISO 6892-1 (ABNT NBR ISO 6892-1:2024 in Brazil).
Quick summary:
- When it starts: at the maximum force Fm, which defines the ultimate tensile strength Rm = Fm / S0.
- Why it starts: according to the Considère criterion, it starts when the work hardening rate falls to the value of the true stress itself.
- What it measures: local ductility, not strength.
- Typical values: about 50% to 70% in low-carbon steel, depending on the condition, and around 2% in gray cast iron.
What necking is in a tensile test
In a tensile test, the specimen starts getting thinner from the very first instant. In the elastic range this lateral contraction is small, uniform and reversible. It is described by Poisson's ratio, which is ν = 0.3 for steel. After yielding, plastic deformation also reduces the cross-section uniformly, because the volume of the metal stays practically constant: as the length increases, the area decreases in the same proportion over the whole parallel length. Neither of these two reductions is necking.
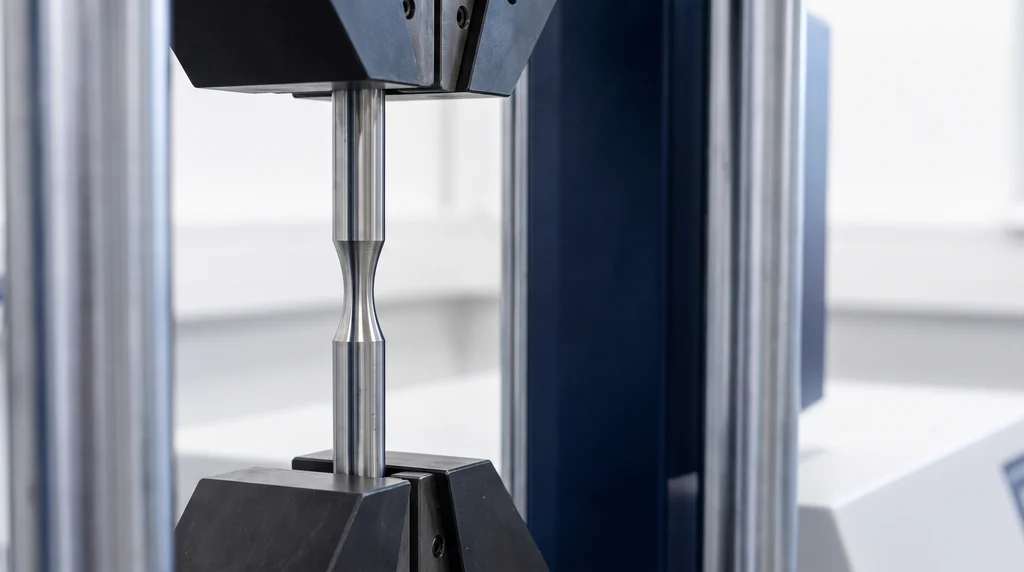
The photo shows a steel specimen still in the grips. The neck has already formed in the middle of the parallel length: the cross-section narrows at one point, and that is where the specimen will fracture.
Necking is the next stage, in which the reduction of the cross-section stops being uniform. From the maximum force onward, one short region thins much more than the rest of the specimen, and almost all the additional elongation happens there. This makes necking plastic and localized. ISO 6892-1:2019 defines the related measure, the percentage reduction of area Z, as the maximum change in cross-sectional area that occurred during the test, expressed as a percentage of S0. In Portuguese, the same word names both the phenomenon and the measure: people speak of estricção, coeficiente de estricção, estricção de ruptura or redução de área. In English, the phenomenon is necking and the measure is the reduction of area (RA or %RA).
Some texts use the term "stretching" (estiramento in Portuguese) as a synonym for necking. In polymers it has a specific meaning, cold drawing. In cold drawing, the neck stabilizes and travels along the specimen instead of leading to fracture. This topic has its own section further on.
A note on interpretation: necking is not an intrinsic property of the material. It describes how the material behaves in the test, because it depends on the geometry of the cross-section and on the stress state in the neck. Even so, Z is specified as a requirement in product standards, such as the ASTM standards for stainless steel bars, and values are comparable between tests made with the same geometry.
When necking starts
The neck does not appear at just any point on the curve. It forms at the moment when two opposing effects, which compete from yielding onward, balance each other. Understanding this balance explains why some metals elongate a great deal before necking and others hardly at all.
Work hardening versus loss of area
The force the specimen carries is the true stress σv multiplied by the instantaneous area: F = σv·S. The true stress is calculated with the current area, not the original one. During plastic deformation, two effects act on this force at the same time. The area S decreases, which tends to reduce F. Meanwhile, work hardening, the strengthening of the metal by plastic deformation itself, raises σv, which tends to increase F.
At the start of plastic deformation, work hardening is strong and wins. If any region of the specimen thins slightly more than its neighbors, it also hardens more and becomes stronger, so the deformation moves to another region. The result is uniform deformation over the whole parallel length. However, the work hardening rate decreases as strain increases. Eventually the gain in strength no longer makes up for the loss of area. The first region to thin is then not strong enough to pass the deformation on, so it keeps thinning and takes up all the elongation. That point is the maximum force, and that is where the neck forms.
Considère criterion
The French engineer Armand Considère formalized this balance in 1885, in a study on the use of iron and steel in construction. The instability condition is that the force stops increasing, dF = 0. With F = σv·S, differentiating gives:
- dF = S·dσv + σv·dS = 0, so dσv / σv = −dS / S.
- Since volume is conserved (S·L = constant), −dS / S = dL / L, which is the true strain increment, dεv.
- Combining the two: dσv / dεv = σv.
In words: necking starts when the slope of the true stress versus true strain curve drops to the value of the true stress itself. Before that, the slope is greater than the stress and the deformation is stable. In terms of engineering strain ε, the same condition becomes dσv / dε = σv / (1 + ε). On a graph, this is the point where a straight line drawn from ε = −1 is tangent to the curve of true stress versus ε. This is called the Considère construction.
Strain hardening exponent n and uniform elongation
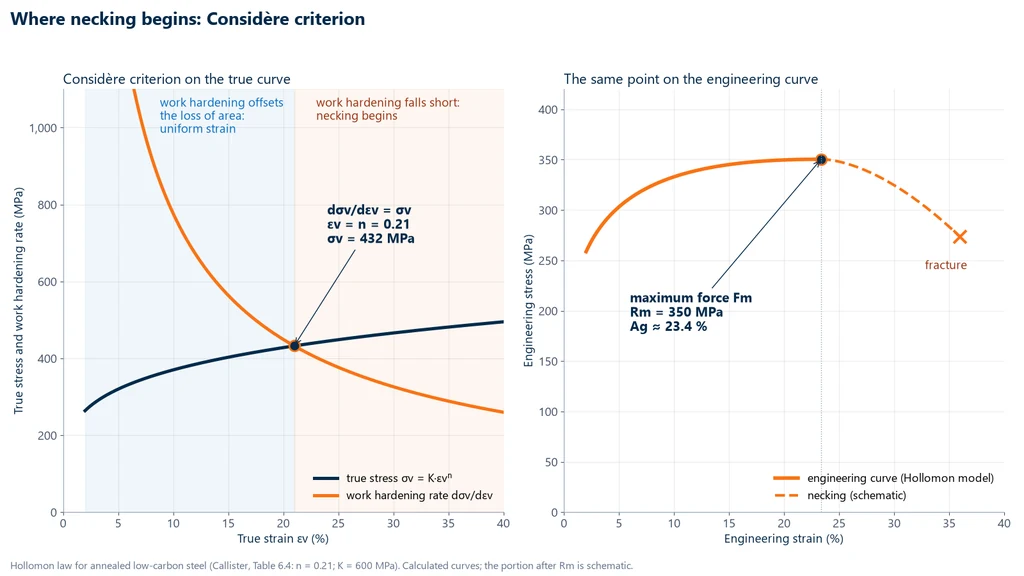
In the plastic range, many metals follow the Hollomon equation: σv = K·εvn. Here K is the strength coefficient, in MPa, and n is the strain hardening exponent, which has no units. The derivative is dσv / dεv = n·K·εvn−1. Setting it equal to K·εvn, as the Considère criterion requires, gives a simple result: necking starts at a true strain of εv = n.
In engineering terms, this strain at the onset of necking is the uniform elongation, which ISO 6892-1 calls Ag: the plastic extension at maximum force, as a percentage. Neglecting the small elastic part, Ag ≈ (en − 1) × 100, with e = 2.718. A metal with a high n hardens more, delays necking and spreads the deformation better. This is why n is the most closely watched number for sheet metal intended for stamping (see the cupping test). The value of n is measured according to ASTM E646-16(2024) or ISO 10275:2020.
The chart below applies the criterion to the Hollomon equation for annealed low-carbon steel from Callister (Table 6.4: n = 0.21 and K = 600 MPa). On the left, the work hardening rate starts very high, falls, and crosses the true stress curve at εv = 0.21 and 432 MPa. On the right, the same moment is the highest point of the engineering curve: Rm of 350 MPa with Ag of 23.4%. Exercise 3 works through these calculations again.
The criterion has limits. It assumes uniaxial tension, uniform deformation up to maximum force and a material with little sensitivity to strain rate. Polymers and superplastic alloys do not fit this model. The relation εv = n holds only if the plastic range actually follows the Hollomon equation, and not every steel does so over the whole strain range. High-strength metals with little work hardening can become unstable almost right after yielding, so their Ag is very small.
Where necking appears on the stress-strain curve
On the stress-strain curve of a ductile metal, necking is the section from the point of maximum force to fracture, points C and D in that article. In this section the engineering curve goes down. The force drops because the neck area shrinks faster than the material hardens, and the calculation still divides the force by the original area S0. The true curve, calculated with the instantaneous area, keeps rising until fracture, because the material in the neck continues to work harden. The force versus displacement plot recorded by the machine has the same shape as the engineering curve: the peak is Fm and the descending section is necking.
The point of maximum force is the ultimate tensile strength, not the fracture point. In a ductile material, fracture happens later, at a lower engineering stress. ISO 6892-1 makes one exception: for a material with discontinuous yielding and no work hardening, the standard does not define the maximum force. The yield strength occurs much earlier, at the start of plastic deformation, and has no direct relation to the neck.
The standard uses a different name for each elongation along this path:
- Ag: plastic extension at maximum force, the uniform elongation.
- Agt: total extension at maximum force, including the elastic part. For steel, Agt ≈ Ag + Rm / E, with E = 200 GPa.
- At: total extension at the moment of fracture.
- A: elongation after fracture. It is measured with the two pieces fitted back together and does not include the elastic part, which recovers when the specimen fractures.
The difference A − Ag is roughly the elongation that concentrated in the neck. Ag and Agt require an extensometer on the specimen during the test. A and Z are measured afterward, on the fractured pieces.
Reduction of area Z: formula and measurement
The reduction of area compares the smallest cross-section after fracture with the original cross-section. It is calculated from two areas, and how you obtain them depends on the specimen geometry.
Formula for round and rectangular sections
The general definition is Z = (S0 − Su) / S0 × 100, with both areas in mm² and Z as a percentage. In a round specimen, the area is proportional to the square of the diameter, so the formula simplifies to Z = [1 − (du / d0)²] × 100. Here d0 is the original diameter and du is the smallest diameter at the neck. Because of the square, the reduction in diameter is always smaller than the reduction in area: a diameter that drops from 10 mm to 6 mm has decreased by 40%, but the area has decreased by 64%. In a flat specimen taken from sheet, the area is the thickness a times the width b, and Z = (a0·b0 − au·bu) / (a0·b0) × 100, with au and bu measured in the necked zone.
The table brings together the three forms and a derived quantity used for the true curve, explained just below:
| Quantity | Formula | Note |
|---|---|---|
| Reduction of area Z | (S0 − Su) / S0 × 100 | ISO 6892-1 definition |
| Z for a round section | [1 − (du / d0)²] × 100 | du: average of two readings at 90° |
| Z for a rectangular section | (a0·b0 − au·bu) / (a0·b0) × 100 | a: thickness; b: width |
| True strain at fracture | εv,f = ln[1 / (1 − Z)] | Z as a fraction |
How to measure Su according to ISO 6892-1
Z does not come from the machine signal. It is measured on the fractured specimen with a caliper, a point micrometer or a profile projector. ISO 6892-1 requires the following:
- Carefully fit the two pieces back together with their axes aligned, without shifting the fracture surfaces during the reading.
- For a round specimen, measure the smallest diameter in two planes at 90° to each other and use the average to calculate Su.
- Measure Su with a recommended accuracy of ±2%. The standard itself notes that this may not be possible for small diameters or non-round geometries.
- Report Z rounded to the nearest 1%.
The complete test procedure, including how to measure S0 and elongation, is in the article on ductility.
True strain at fracture
Since volume is conserved, the true strain in the neck can be calculated from the areas: εv,f = ln(S0 / Su) = ln[1 / (1 − Z)], with Z as a fraction. For a round section, this equals 2·ln(d0 / du). A steel with Z = 64% reached εv,f = ln(1 / 0.36) = 1.02 in the neck. That is far higher than the strain read between the gauge length marks. This value provides the last point of the true curve, and it is why simulations and fracture models use Z more than A.
Reduction of area Z and elongation A
The two ductility measures from a tensile test answer different questions. Elongation after fracture A adds two parts together. The uniform deformation is proportional to the original gauge length L0. The neck deformation is concentrated in a short section and hardly depends on L0. As a result, the same material gives different values of A for L0 = 5.65√S0, for 50 mm or for 10 diameters. ISO 6892-1 only allows elongations to be compared when they were measured with the same gauge length or the same proportionality coefficient (5.65 is preferred).
Z is measured at a single cross-section, the smallest one, and depends much less on the gauge length. It describes local ductility, which is the ductility the material shows where it actually fractures. In practice, both values appear together on test certificates. The article on ductility compares A and Z and gives the factors for converting elongation between gauge lengths.
Typical reduction of area values by material
The value of Z varies widely with the delivery condition of the same steel. For 1020, annealing and normalizing, which remove work hardening and refine the microstructure, give Z of about 66% to 68%. Cold drawing raises the tensile strength to about 420 MPa and the yield strength to about 350 MPa, but it uses up part of the ductility before the test: elongation drops to about 15% and Z to about 41%. Minimum values from standards, such as those of ASTM A276 for stainless steel bars, are acceptance requirements and sit below the typical values. The last two rows come from a single specimen in textbook problems and serve as examples, not as typical values.
| Material and condition | Rm (MPa) | Z (%) | Source |
|---|---|---|---|
| 1020 steel, hot rolled, 19 to 32 mm bar | 380 | 50 | ASM; MatWeb |
| 1020 steel, cold drawn | 420 | 41 | ASM (typical) |
| 1020 steel, annealed at 870 °C | 395 | 66 | AZoM (2012) |
| 1020 steel, normalized at 870 °C | 441 | 68 | ASM |
| 304 stainless steel, annealed 25.4 mm bar | 585 | 70 | ASM data (typical) |
| 304 stainless steel, hot finished and annealed (minimum) | ≥ 515 | ≥ 50 | ASTM A276 |
| 304 stainless steel, annealed, for pressure vessels (minimum) | ≥ 515 | ≥ 40 | ASTM A479 |
| 6061-T6 aluminum, one specimen | n/a | 56.5 | Dowling (textbook problem) |
| Gray cast iron, one specimen | n/a | 1.9 | Dowling (textbook problem) |
The treatments that raise Z in 1020 steel are covered in annealing and normalizing.
Cup-and-cone fracture and brittle fracture
In ductile metals, necking ends in a fracture with a characteristic shape, the cup-and-cone. It starts at the center of the neck, not at the surface, because the thinning creates a triaxial stress state there: in addition to the axial tension, radial and circumferential tensile stresses appear, and the hydrostatic tensile component is highest on the specimen axis. This triaxiality makes it easier for voids to open. The sequence, described by Callister and analyzed numerically by Tvergaard and Needleman (1984), has five stages:
- The neck forms and concentrates the deformation.
- Microvoids nucleate at the center of the neck, usually at inclusions and second-phase particles.
- The voids grow and coalesce into a central crack, flat and perpendicular to the axis.
- The crack advances rapidly toward the surface.
- The outer ring fails by shear at about 45° to the axis, which is the plane of maximum shear stress. One half keeps a raised rim, the cup, and the other a protruding center, the cone.
The diagram below shows these five stages in a longitudinal section of the specimen and, in the last panel, the fracture of a brittle material, which breaks with a flat surface and no neck.
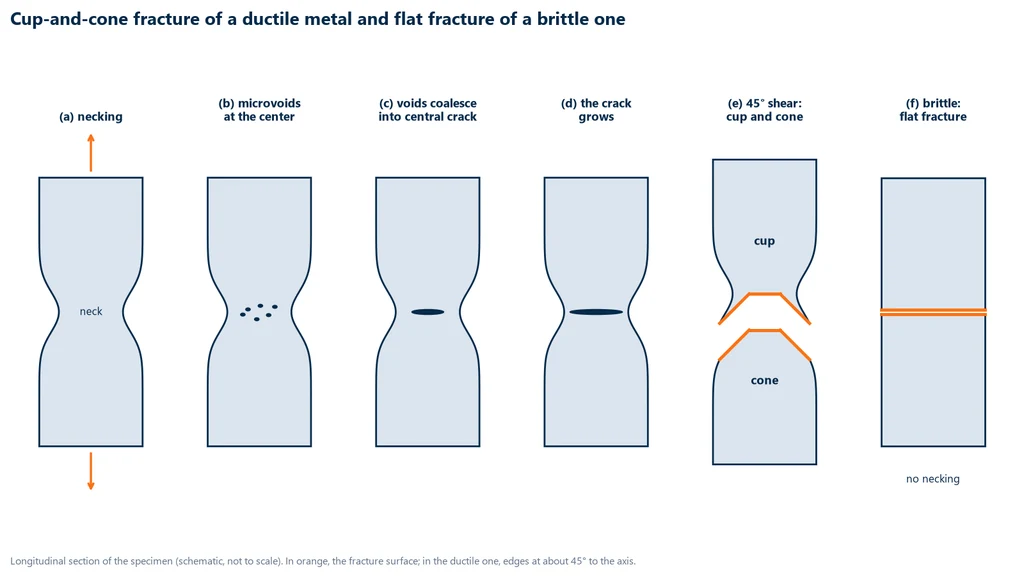
In a brittle material the crack propagates before any appreciable plastic deformation, and the fracture is flat, perpendicular to the load. Gray cast iron is the classic example: in a problem from Dowling, the diameter goes from 8.57 mm to 8.49 mm, which gives a Z of only 1.9%. The appearance of the fracture is therefore a quick reading of the behavior: a dull, fibrous cup-and-cone indicates ductile failure with necking; a flat, shiny surface indicates brittle failure. The energy absorbed up to fracture is covered in toughness, and the ductile-to-brittle transition with temperature in the impact test.
Stress in the neck and the Bridgman correction
After maximum force, the conversions σv = σ·(1 + ε) and εv = ln(1 + ε), with engineering σ and ε, which assume uniform deformation, no longer apply. The average true stress in the neck becomes the force divided by the measured minimum area, σv = F / S. At fracture, σv,f = Ff / Su, as in Exercise 2.
Even this average overestimates the stress the material actually needs to yield, because of the triaxiality described in the previous section: part of the axial stress is balanced by the radial and circumferential stresses. In 1952, P. W. Bridgman proposed a correction factor for round specimens:
σ = σaverage / [(1 + 2R/a)·ln(1 + a/(2R))]
where a is the minimum radius of the neck and R the radius of curvature of the neck profile. As an illustration, with a/R = 0.5 the denominator equals 5 × ln 1.25 = 1.116, and the average stress of 658 MPa from Exercise 2 would drop to about 590 MPa, a correction of about 10%. The correction has practical limits: measuring R during the test is difficult, and the formula loses accuracy at large strains. Tsuchida and coauthors (2011) observed that, for most of the metals studied, it only becomes significant when the strain reaches about twice the uniform elongation. The corrected true curve is the one used in finite element simulation when the analysis needs to go beyond maximum force.
Cold drawing in polymers
In many semicrystalline thermoplastics, such as polyethylene, polypropylene, PET and nylon, the neck does not lead to immediate fracture. After a yield peak, the neck forms, the force drops and then levels off, and the neck begins to propagate along the specimen at roughly constant force until it occupies almost the entire gauge length. This regime is called cold drawing (stable neck propagation). Only after the neck has traveled through the specimen does the force rise again, up to fracture.
The mechanism differs from that of metals. Inside the neck, the crystalline lamellae break up and the chains align in the loading direction, forming oriented microfibrils. This alignment strongly hardens the drawn material, and the already drawn region becomes stronger than the adjacent undrawn region, which becomes the next to yield. The ratio between the drawn length and the original length within the stable neck is the natural draw ratio; in linear polyethylene drawn at 60 °C and 100 °C, for example, it was 10 (Textile Research Journal, 1971). The value depends on the polymer grade and the temperature.
The Considère construction also explains this behavior when plotted as true stress versus draw ratio λ, with the tangent drawn from λ = 0. If there are two points of tangency, the material necks and then cold draws stably; with only one, it necks and breaks; with none, it deforms uniformly until fracture. The same principle is used in industry to orient fibers and films. The tests follow ASTM D638-22 and ISO 527-1:2019, and the large elongation requires an extensometer and machine crosshead travel to match.
Worked examples
The five exercises follow the order of the article: calculation of Z, true stress at fracture, onset of necking, comparison of conditions of the same steel, and the contrast between ductile, brittle and sheet.
Exercise 1: reduction of area and true strain at fracture
A cylindrical carbon steel specimen with d0 = 10.00 mm breaks with a cup-and-cone fracture. With the halves fitted together, the smallest diameter measured in two planes at 90° is 6.05 mm and 5.95 mm. Calculate Z and εv,f.
- Final diameter: du = (6.05 + 5.95) / 2 = 6.00 mm.
- Areas: S0 = π × 10.00² / 4 = 78.54 mm²; Su = π × 6.00² / 4 = 28.27 mm².
- Z = (78.54 − 28.27) / 78.54 × 100 = 64.0%. Using the shortcut: 1 − (6 / 10)² = 0.64. Rounded to 1%: Z = 64%.
- εv,f = ln(1 / 0.36) = 1.02.
The result is close to the annealed or normalized 1020 in the table (66% to 68%). If the steel had an Rm of 395 MPa, like annealed 1020, the maximum force would be 395 × 78.54 = 31.0 kN.
Exercise 2: true stress at fracture (Callister, Example 6.4)
A steel with d0 = 12.8 mm has an engineering fracture strength of 460 MPa and a diameter at fracture of 10.7 mm. Calculate Z and the true stress at fracture.
- S0 = π × 6.4² = 128.7 mm²; Su = π × 5.35² = 89.9 mm².
- Z = (128.7 − 89.9) / 128.7 × 100 = 30%.
- Force at fracture: Ff = 460 × 128.7 = 59,200 N.
- σv,f = 59,200 / 89.9 = 658 MPa, about 660 MPa, well above the engineering 460 MPa.
Exercise 3: onset of necking by the Considère criterion
Annealed low-carbon steel follows σv = K·εvn, with K = 600 MPa and n = 0.21 (Callister, Table 6.4). Estimate the strain at the onset of necking, Ag, Agt and Rm.
- Considère with Hollomon: εv = n = 0.21.
- Engineering strain: ε = e0.21 − 1 = 0.234, with e = 2.718, that is, Ag ≈ 23.4%.
- True stress at the onset of necking: σv = 600 × 0.210.21 = 600 × 0.7206 = 432 MPa.
- Rm = σv / (1 + ε) = 432 / 1.234 = 350 MPa.
- Agt ≈ 23.4% + 350 / 200,000 × 100 = 23.4% + 0.2% = 23.6%.
These values are model estimates, not measurements. In practice, n is measured per ASTM E646 or ISO 10275, and Ag with an extensometer.
Exercise 4: the same steel in two conditions
Hot-rolled 1020 steel has Z = 50% and cold-drawn 1020 has Z = 41% (table above). Which one withstands more local deformation before fracture, and by how much?
- Hot rolled: εv,f = ln[1 / (1 − 0.50)] = ln 2.000 = 0.693.
- Cold drawn: εv,f = ln[1 / (1 − 0.41)] = ln 1.695 = 0.528.
- Ratio: 0.693 / 0.528 = 1.31.
The hot-rolled steel withstands about 31% more local true strain. The cold-drawn steel has already used up part of its ductility in the work hardening from drawing, which is consistent with its higher Rm (420 versus 380 MPa).
Exercise 5: ductile, brittle and rectangular cross-section
Three quick cases. The first two use data from Dowling problems; the third is a hypothetical sheet.
- 6061-T6 aluminum, from 9.48 mm to 6.25 mm: Z = 1 − (6.25 / 9.48)² = 1 − 0.4347 = 56.5%.
- Gray cast iron, from 8.57 mm to 8.49 mm: Z = 1 − (8.49 / 8.57)² = 1 − 0.9814 = 1.9%, with a flat fracture and no visible neck.
- Sheet with a0 = 2.00 mm and b0 = 12.5 mm, and au = 1.40 mm and bu = 10.0 mm at the neck: S0 = 25.0 mm², Su = 14.0 mm² and Z = 11.0 / 25.0 = 44%.
Common mistakes about necking
Six misconceptions come up often in texts and reports on the subject:
- Calling any reduction in cross-section necking. The elastic Poisson contraction and the uniform plastic reduction happen earlier; necking is the localized reduction that starts at maximum force.
- Measuring necking by elongation. Elongation A measures length; necking is measured by area, with Z.
- Treating necking as an indicator of strength. It indicates local ductility. Strength is given by Rm and the yield strength.
- Saying that, in the neck, the material can no longer carry stress. The force drops, but the true stress in the neck keeps rising until fracture. In polymers, the neck may even keep propagating stably over large strains.
- Using the reduction in diameter instead of the reduction of area. A diameter 40% smaller corresponds to a Z of 64%, and the standard uses area.
- Calling necking elastic deformation. The neck is plastic, permanent deformation; the broken part retains the thinning.
Reduction of area standards
The definition of Z and the measurement procedure come from the tensile testing standards for metals; the exponent n, which predicts the onset of necking, and the tensile testing of plastics have their own standards. The table lists those cited in this article:
| Standard | Scope | Edition |
|---|---|---|
| ABNT NBR ISO 6892-1 | Brazilian adoption of ISO 6892-1: tensile testing of metals at room temperature; definition and measurement of Z, Ag, Agt and A | 2024 |
| ISO 6892-1 | tensile testing of metals at room temperature | 2019 |
| ASTM E8/E8M | tensile testing of metals, including reduction of area | E8/E8M-25 |
| ASTM A370 | mechanical testing of steel products | A370-26 |
| ASTM E646 | strain hardening exponent n of metallic sheet | E646-16(2024) |
| ISO 10275 | strain hardening exponent n of sheet and strip | 2020 |
| ASTM A276 and ASTM A479 | stainless steel bars, with minimum Z as a requirement | not specified |
| ASTM D638 | tensile testing of plastics | D638-22 |
| ISO 527-1 | tensile testing of plastics, general principles | 2019 |
Testing machine for measuring necking
To measure necking, the machine must pull the test specimen to fracture at a controlled speed, record the maximum force, which marks the onset of the neck, and, with an extensometer, measure Ag and Agt at that point. Z is measured afterwards, on the fitted-together halves. The Biopdi M2 universal testing machine is electromechanical, with single-column models from 200 N to 10 kN and dual-column models from 5 kN to 1,000 kN, plus extensometers and the BioLab software. The panel below shows the machine, the role of each part in this test and the grips used.
The universal testing machine in the tensile test
The M2 line has single-column models from 200 N to 10 kN and dual-column models from 5 kN to 1,000 kN. Each part of the machine has a role in the test that ends with necking:
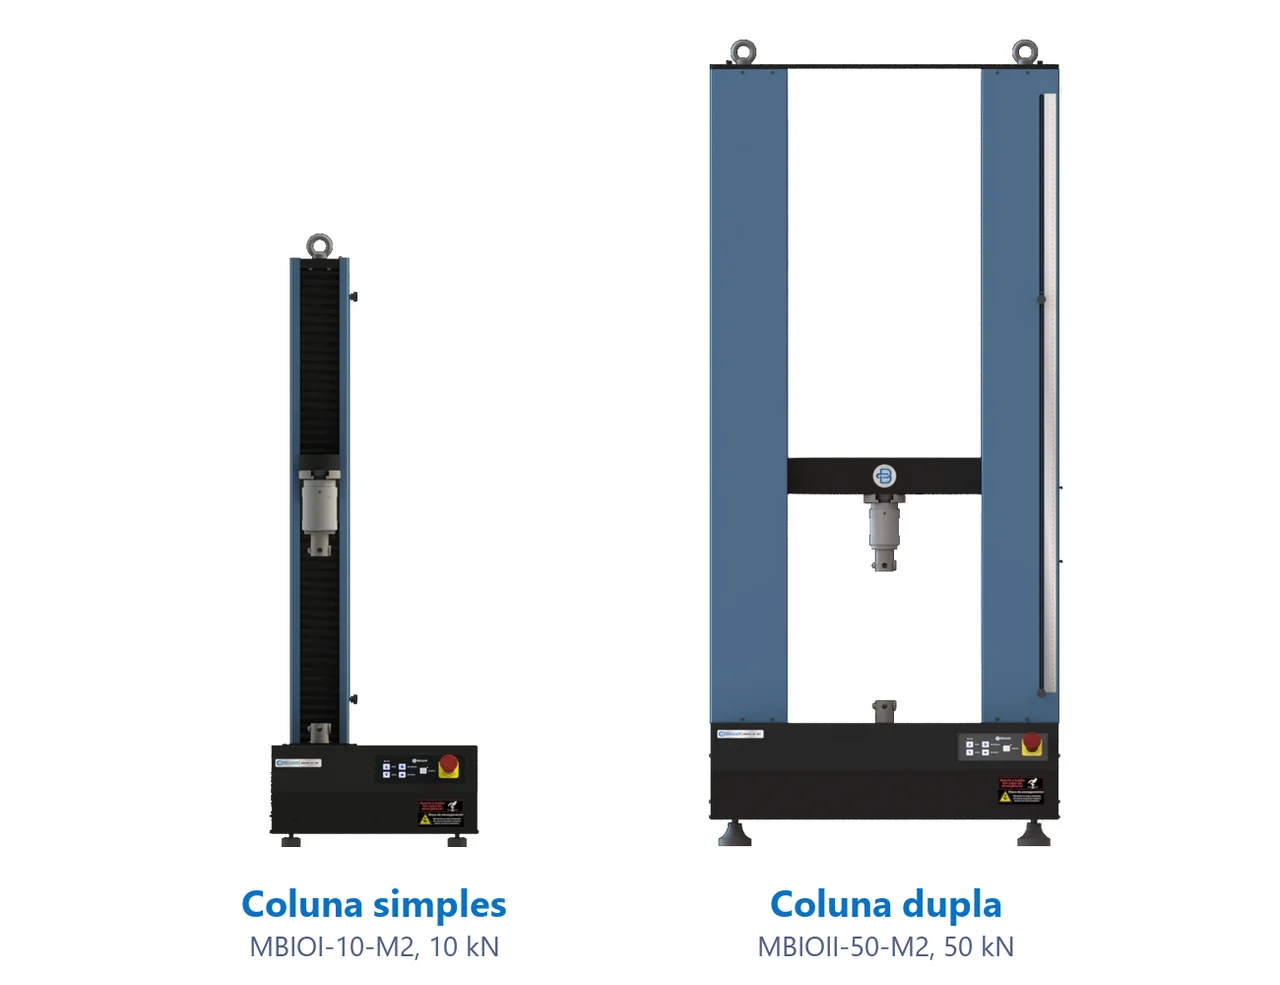
- Moving crosshead pulls the test specimen to fracture at the speed set by the standard
- Load cell measures the force and records Fm, the onset of the neck
- Grips: wedge, pneumatic, for threaded specimens or wires
- Extensometer measures the extension over the gauge length L0, for Ag and Agt
- BioLab software plots the curve and calculates Rm and the elongations
- Control panel and emergency stop position and stop the test
Fixtures for the tensile test
The fixtures below are mounted on the same machine, depending on the test specimen and the standard:
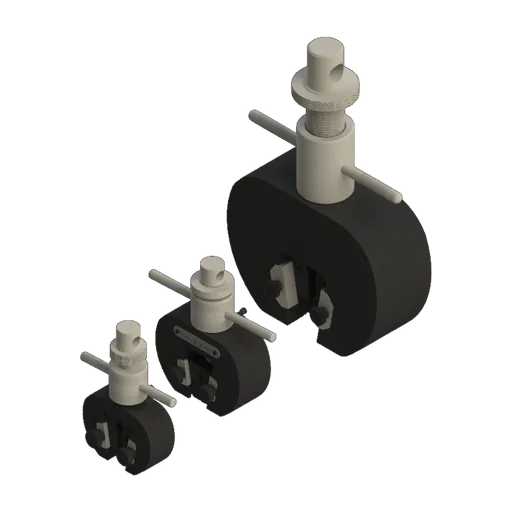 Wedge grip5, 20 and 200 kN
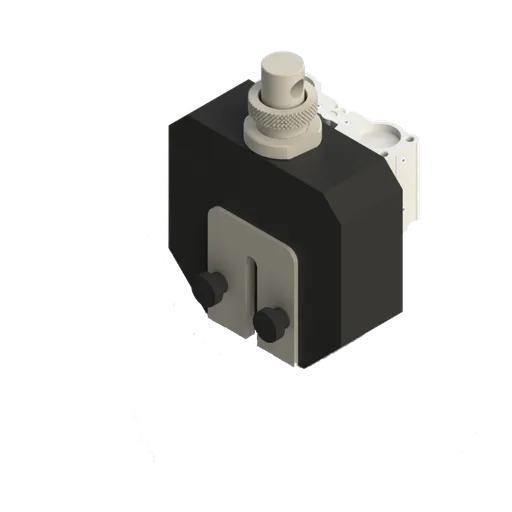 Pneumatic wedge grip50 and 200 kN
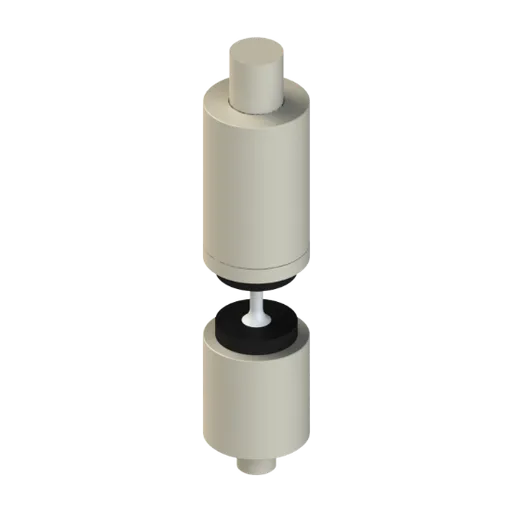 Grip for threaded specimensbolts and threaded test specimens
The capacity follows the material. For steel bars like the one in Exercise 1, with a maximum force of about 31 kN, the range is that of the dual-column machine from 5 to 50 kN (MBIOII-50-M2); rebar, structural sections and cables call for the 100 to 200 kN model (MBIOII-200-M2). For polymers that cold draw, where the neck travels along the whole test specimen, the extended single-column model provides the stroke needed. The BioLab software report brings together the curve and the test results. The other capacities are on the universal testing machine page.
Other tests and technical references
Ductility: what it is, how to calculate it, ductile vs. brittle materials and examples
Ductility is how much a material deforms plastically before it fractures. See the elongation and reduction of area formulas, ductile vs. brittle materials and real values.
Toughness of materials: what it is, how to calculate it and units
Toughness is the energy a material absorbs before fracturing. Learn how to calculate it, units, the Charpy test, fracture toughness and reference values.
Mechanical strength: what it is, types, formula and values
Mechanical strength is the maximum stress a material bears before yielding or breaking (MPa). Types, formulas, tests, standards and values by material.
Plastic deformation: what it is, mechanism, formulas, metal forming and exercises
Plastic deformation is the permanent change of shape that remains in a material after the load is removed. In metals it begins at the yield strength and occurs through the movement of dislocations. See the mechanism, the formulas (εp = ε − σ/E and true strain), cold and hot working, how to measure it in a tensile test, and solved exercises.
Frequently asked questions
What is necking in the tensile test?
It is the localized reduction of the cross-section of the test specimen, the neck, which begins when the force reaches its maximum (Rm) and concentrates until fracture. It occurs in ductile materials and is measured by the percentage reduction of area Z, defined in ISO 6892-1.
Are necking and "empescoçamento" the same thing?
Yes. In Portuguese, "empescoçamento" and "formação de pescoço" translate the English term necking, while "estricção" names both the phenomenon and its measure, Z. In polymers, the stable propagation of the neck is called cold drawing.
How do you calculate the reduction of area Z?
Z = (S0 − Su) / S0 × 100, where S0 is the original area and Su the minimum area after fracture. For a round test specimen, Z = [1 − (du / d0)²] × 100. A diameter that goes from 10 mm to 6 mm gives Z = 64%.
At what point on the curve does necking begin?
At the maximum force, which defines the ultimate tensile strength Rm. After that point the engineering curve drops, but the true stress curve keeps rising, because the material in the neck is still work hardening.
Why does necking happen?
Because work hardening no longer compensates for the loss of area. By the Considère criterion (1885), the neck begins when dσv/dεv = σv. In a material that follows the Hollomon law, σ = K·εⁿ, this occurs at a true strain equal to n.
What is the difference between reduction of area and elongation?
Elongation A measures the increase in gauge length and depends on it. Z measures the smallest cross-section and depends much less on the gauge length. That is why elongations can only be compared for the same gauge length.
What is the typical Z value for steel?
It depends on the condition. For 1020 steel, about 50% hot rolled, 66% annealed, 68% normalized and 41% cold drawn. Annealed 304 stainless steel is around 70%, with a minimum of 50% under ASTM A276 for the hot-finished and annealed condition.
Does cast iron neck?
Practically not. Gray cast iron fails with a flat fracture and a reduction of area of about 2%: in a problem from Dowling, the diameter goes from 8.57 mm to 8.49 mm, which gives Z of 1.9%.
What is a cup-and-cone fracture?
It is the typical fracture of a ductile metal after necking. Microvoids nucleate at the center of the neck, coalesce into a flat crack, and fracture ends by shear at about 45°, leaving a cup on one half and a cone on the other.
How is Su measured according to the standard?
The two halves are fitted together with their axes aligned, the minimum diameter is measured in two planes at 90° and the average is used. ISO 6892-1 recommends an accuracy of ±2% for Su and the Z result rounded to the nearest 1%.
What is the Bridgman correction?
It is a factor that accounts for the triaxial stress state in the neck: σ = σmédia / [(1 + 2R/a)·ln(1 + a/2R)], where a is the minimum radius and R the radius of curvature of the neck. It was proposed by Bridgman in 1952 and loses accuracy at large strains.
Why does the neck in a plastic propagate instead of breaking?
In many semicrystalline polymers, the chains align inside the neck and the drawn material hardens. The neck stabilizes and advances along the test specimen at an almost constant force: this is cold drawing.