
In strength of materials, the proportional limit is the highest stress a material can withstand while stress and strain are still directly proportional, that is, the end of the straight portion of the stress-strain curve. Up to this point Hooke's law holds: stress equals the modulus of elasticity multiplied by strain. Going past it does not, by itself, mean the material is permanently deformed. In metals, the order is proportional limit ≤ elastic limit ≤ offset yield strength, and the first two almost coincide. The value is read at the beginning of the stress-strain curve obtained in the tensile test.
What is the proportional limit
The definition uses two quantities from the tensile test. Engineering stress is σ = F / S0, the force divided by the original cross-sectional area; with force in newtons and area in mm², it comes out in N/mm², which is the same as MPa. Engineering strain is ε = ΔL / L0, the elongation divided by the original gauge length. In the test, L0 is the gauge length of the extensometer, the instrument attached to the test specimen that measures elongation. Strain is dimensionless (mm/mm) and is usually given in %.
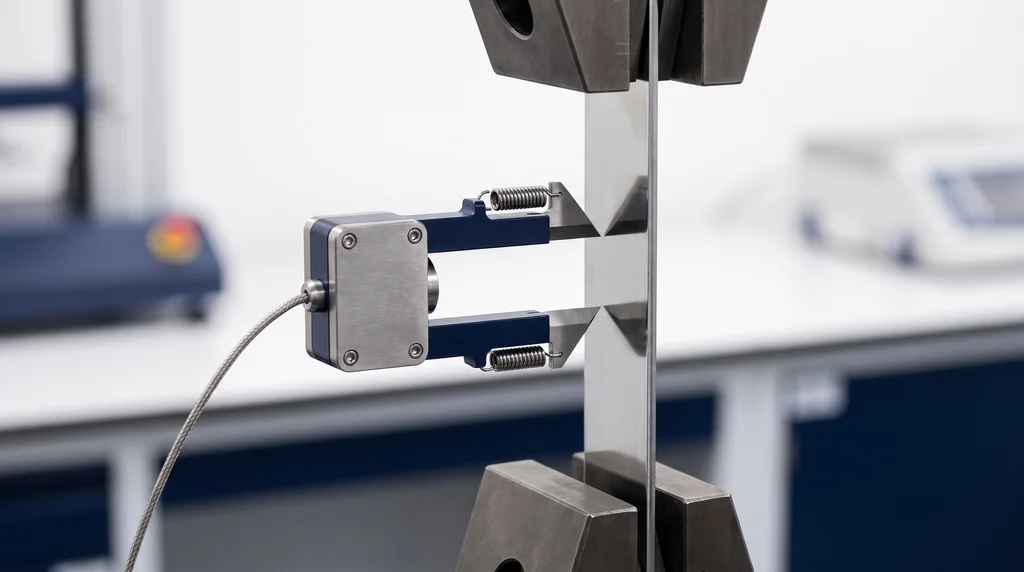
The photo shows a clip-on extensometer attached to a flat specimen: the two knife edges mark the gauge length, and only with this measurement can the end of the straight portion of the curve be located.
With σ on the vertical axis and ε on the horizontal axis, the first points of a metal fall on a straight line starting at the origin. The proportional limit is where that line ends. ASTM E6, the terminology standard for mechanical testing, defines the term as "the greatest stress that a material is capable of sustaining without any deviation from proportionality of stress to strain (Hooke's law)". ASTM E111, for the modulus of elasticity, and ASTM D638, for plastics, use the same definition.
In textbooks the symbol appears as σLP, σp or σpl. ISO 6892-1, the international standard for tensile testing of metals, has no symbol for it, because it does not determine it; the reasons are explained further on.
A widespread mistake is to treat this point as the onset of permanent deformation. The end of the straight portion is the end of linearity, not the end of elasticity; permanent deformation is the criterion of another limit, the elastic limit, discussed below.
Hooke's law and modulus of elasticity: how far they apply
Robert Hooke published the idea in 1676, encoded in the anagram "ceiiinosssttuu", and explained it in 1678 in Lectures de Potentia Restitutiva, or Of Spring: "Ut tensio, sic vis", the force of a spring is in the same proportion as its extension. Applied to a material, Hooke's law becomes σ = E·ε, and the constant E is the modulus of elasticity, or Young's modulus.
The proportional limit is, by definition, the upper bound of validity of this equation. ASTM E6 defines the modulus as the ratio of stress to strain below the proportional limit, and ASTM E111 requires it to be calculated from points in that range: E = Δσ / Δε = (σ2 − σ1) / (ε2 − ε1). Above the limit, σ no longer equals E·ε, and a deflection or elongation calculation made with E underestimates the actual deformation. The table gives E for common alloys at room temperature, the slope of the straight portion for each one:
| Alloy | E (GPa) | Poisson's ratio ν |
|---|---|---|
| Steel | 207 | 0.30 |
| Nickel | 207 | 0.31 |
| Copper | 110 | 0.34 |
| Titanium | 107 | 0.34 |
| Brass | 97 | 0.34 |
| Aluminum | 69 | 0.33 |
| Magnesium | 45 | 0.29 |
Values are from Callister and Rethwisch, Table 6.1. Poisson's ratio, the ratio of lateral to axial strain, also exists only below the proportional limit: above it, says ASTM E6, this ratio becomes stress-dependent and should not be treated as Poisson's ratio. For steel, see the modulus of elasticity of steel.
The straight portion also stores energy. The area of the triangle under it is the modulus of resilience, Ur = σLP² / (2E), the energy per unit volume the material absorbs and returns when unloaded. Many textbooks, such as Hibbeler, use the yield strength instead of σLP as an approximation, and exercise 3 shows the difference.
Proportional limit vs. elastic limit: what is the difference
The elastic limit answers a different question. Per ASTM E6, it is "the greatest stress which a material is capable of sustaining without any permanent strain remaining upon complete release of the stress". The proportional limit looks at the shape of the curve during loading; the elastic limit looks at what remains after unloading. A material can remain elastic after it stops being linear, so the proportional limit is equal to or below the elastic limit.
Measuring the elastic limit is laborious: it requires loading and unloading the specimen with increasing loads and checking, after each cycle, whether any strain remains. The result depends on the sensitivity of the measurement. With instruments able to detect microstrains on the order of 2×10⁻⁶, one obtains the so-called true elastic limit, associated with the movement of a few hundred dislocations, the crystal lattice defects whose slip produces plastic deformation. With the usual engineering sensitivity, around 10⁻⁴, the elastic limit comes out above the proportional limit (ASM, via Total Materia). The more sensitive the instrument, the lower the value.
In metals the two limits almost coincide, because the loss of linearity usually comes from the onset of plastic flow (Roylance, MIT). That is why many courses use the same value for both, and Dieter notes that the proportional limit is often used in place of the elastic limit because it is easier to obtain. In elastomers the opposite happens: rubber is elastic and nonlinear from the start, the proportional limit is low or not even defined, and the elastic limit lies far above it.
Is the proportional limit the yield strength?
No. Engineering yield strength is a conventional quantity: ISO 6892-1:2019 defines Rp as the stress at which the plastic extension reaches a specified percentage of the extensometer gauge length, usually 0.2%, the Rp0.2. It is obtained by drawing a line parallel to the straight portion, offset by 0.2% on the strain axis; the point where it intersects the curve is Rp0.2. Low-carbon steels instead show a yield plateau, with an upper yield strength (ReH) and a lower yield strength (ReL). The complete method, with examples, is in the article on the elastic limit and yield strength.
The confusion arises because steel with a yield plateau shows similar values, and because summaries, including those from search engines, describe yielding as "the point just after the proportional limit, where permanent deformation begins". Permanent deformation begins just above the elastic limit, before Rp0.2, which by definition already includes 0.2% plastic strain. And the 0.2% offset is the one used for metals; 2% is usual for plastics.
Yield symbols also vary. ISO 6892-1 uses ReH, ReL and Rp0.2; textbooks use σy or σe; the rebar standard ABNT NBR 7480:2024 (the Brazilian standard for steel reinforcing bars) uses fy and the characteristic value fyk.
The chart below zooms in on the beginning of the curve of an alloy without a yield plateau, calculated to pass through the points of exercise 1, and marks the three limits in order. Point A is the end of the straight portion, at about 240 MPa. Point B is the elastic limit at a sensitivity of 0.01%: unloaded along a line parallel to the Hooke line, it leaves that amount of permanent strain, and lies at about 280 MPa. Point C is Rp0.2, where the offset line intersects the curve, at about 303 MPa. The chart also shows that the unloading line from B and the offset line at C are parallel to the Hooke line: both measure permanent strain, one of 0.01% and the other of 0.2%.
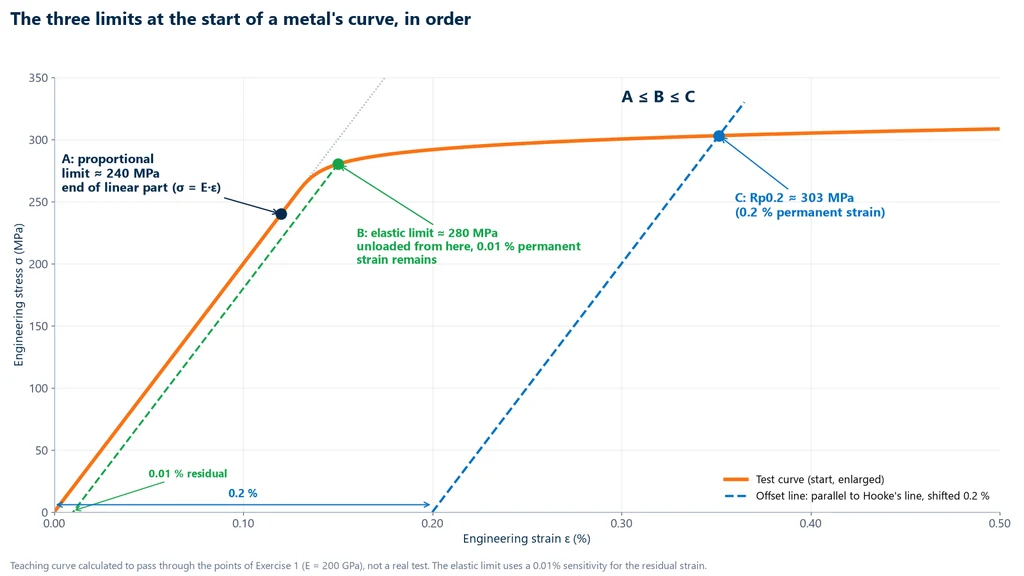
The four limits at the beginning of the curve
Adding the true elastic limit, there are four values at the beginning of the curve, from lowest to highest. The table summarizes what each one measures and where it is used, according to ASM and Dieter:
| Limit | What it defines | How it is measured | Where it is used |
|---|---|---|---|
| True elastic limit | first permanent strain | microstrain on the order of 2×10⁻⁶ | research |
| Proportional limit | end of the σ = E·ε relationship | deviation from the line, with a stated criterion | teaching, modulus calculation, linear range |
| Elastic limit | highest σ without measurable permanent strain | loading and unloading cycles | special characterization |
| Offset yield strength | σ at 0.2% plastic strain (Rp0.2) or yield plateau (ReH, ReL) | offset line or reading of the plateau | standards, specifications and design |
How to determine the proportional limit in the test
The value comes from the tensile test on a universal testing machine. The load cell measures the force F, the extensometer measures the elongation ΔL over its gauge length, and the software converts the pair into σ and ε, plots the curve and fits the line to the initial portion. The difficulty is that the curve departs from the line gradually, and where the departure is declared depends on the instrument and the criterion.
Why the value depends on the equipment
ASTM E6 includes a note about this: observed values of the proportional limit vary greatly with the sensitivity and accuracy of the testing equipment, eccentricity of loading and the scale of the plot. Therefore, when the value is required, the procedure and the sensitivity of the equipment must be specified. In metals without a yield plateau, such as aluminum, copper and stainless steels, the departure from the line is gradual, and the "point" depends entirely on the criterion.
The beginning of the curve also has its own noise. In the first moments the specimen settles in the grips and the clearances close; ISO 6892-1 allows a preload of up to 5% of the expected yield strength to align the setup. In polymers there is an initial curved region, the toe region. ASTM E111 requires the fit to start above a preload, so that this portion is not included in the line.
Line fitting and deviation criterion
There are four documented ways to find the line and where it ends:
- Graphical (ASTM E111, 9.2): the line is drawn over the linear portion and two points are chosen as far apart as possible, both below the limit.
- Least-squares regression (ASTM E111, 9.3): the line is fitted to the (σ, ε) pairs in the range and the variability of the slope is evaluated, through the coefficient of variation or the confidence interval.
- Deviation criterion: the limit is the first point at which the curve departs from the line by more than a value defined before the test. One published example is a 2% drop in slope relative to the elastic range (Brannigan, 2015, on biocompatible alloys). No standard sets a single criterion; what ASTM E6 requires is stating the one used.
- Objective algorithm (ASTM E3076-25): the SDAR method searches for the most linear region of the record by the smallest normalized residual and applies metrics for noise, resolution and goodness of fit. The stated aim is to remove the choice of the linear range from the operator.
The elastic limit, by contrast, does not come out of these constructions: it requires the loading and unloading cycles described in the previous section.
Extensometer, not crosshead
The machine's crosshead displacement adds the slack in the grips and the deformation of the machine itself to the elongation of the specimen. The result is a flatter line, with an apparent modulus far below the real one, and an end of the straight portion in a different place; exercise 5 measures the size of the error. ISO 6892-1:2019 makes the extensometer mandatory for determining Rp and requires ISO 9513 class 1 for Rp, with an ISO 7500-1 class 1 force-measuring system. The extensometer gauge length should cover as much of the parallel length as possible, and specimen alignment matters in yield strength measurement. For the proportional limit, lower on the curve, these requirements apply all the more.
Why standards specify yield strength, not the proportional limit
ISO 6892-1:2019, the basis of ABNT NBR ISO 6892-1:2024 (its Brazilian adoption), determines the upper and lower yield strengths, the offset stresses such as Rp0.2, and the tensile strength, and has no clause for the proportional limit. The scope of ASTM E8/E8M-25 does not include it either: it covers yield strength, ultimate tensile strength, elongation and reduction of area. The reason is in the ASTM E6 note: a value that changes with the equipment cannot be used to accept a lot or compare suppliers. The offset, according to ASM, exists to avoid the practical difficulties of measuring the elastic limit or the proportional limit.
CA-50 rebar (a Brazilian reinforcing steel grade) illustrates the choice: ABNT NBR 7480:2024 specifies it by fyk ≥ 500 MPa, a yield strength. The proportional limit remains important in design, as the boundary of validity for calculations made with E: springs, load cells and electrical resistance strain gauges operate well below it precisely so that they respond linearly.
Materials without a straight portion
Not every material has a clear straight portion. For these, ASTM E6 recommends working with other moduli, always stating the points used: the tangent modulus, the slope of the curve at a point; the secant modulus, the slope of the line joining the origin to a point on the curve; and the chord modulus, the slope of the line between two points on the curve. By material:
- Gray cast iron and annealed copper: they have practically no linear portion. The offset method does not apply, and yield strength is defined by the stress at a specified total strain, for example 0.5% (ASM).
- Plastics: ISO 527-1:2019 defines the tensile modulus Et as the slope between ε = 0.05% and ε = 0.25%, by chord or by regression, without relying on a proportional limit.
- Concrete: ABNT NBR 8522-1:2021 (the Brazilian standard for the modulus of elasticity of concrete) determines the initial tangent modulus Eci as a chord modulus between 0.5 MPa and 30% of the compressive strength, after preload cycles. The article on the modulus of elasticity of concrete covers the test.
- Elastomers: they are elastic and nonlinear; the proportional limit is low or not defined, and the elastic limit lies far above it.
- Ceramics and glass: the curve is practically linear up to fracture (Roylance), with no proportional limit separate from failure.
Worked examples
All five examples use illustrative data that we built for this article and checked by hand. They are not real measurements. The first three follow the same steel specimen from the limit to the modulus and then to the energy. The fourth applies Hooke's law to an aluminum bar, and the last one shows what goes wrong when strain is measured from the crosshead.
Example 1: finding the proportional limit in a test data table
Steel test specimen with d0 = 10.0 mm, so S0 = π × 10.0² / 4 = 78.54 mm². Elongation was measured with a clip-on extensometer with a gauge length of L0 = 50 mm. The criterion was declared before the test: the proportional limit is the last point whose stress is within 1% of the line σ = E·ε, with E = 200 GPa (the slope of the first points, calculated in example 2). The table lists the eight recorded points, the measured stress and the stress the line predicts for the same strain:
| F (kN) | ΔL (mm) | σ = F / S0 (MPa) | Line E·ε (MPa) and deviation |
|---|---|---|---|
| 3.14 | 0.010 | 40.0 | 40 (0%) |
| 6.28 | 0.020 | 80.0 | 80 (0%) |
| 9.42 | 0.030 | 119.9 | 120 (0%) |
| 12.57 | 0.040 | 160.0 | 160 (0%) |
| 15.71 | 0.050 | 200.0 | 200 (0%) |
| 18.85 | 0.060 | 240.0 | 240 (0%) |
| 21.50 | 0.070 | 273.7 | 280 (−2.2%) |
| 22.30 | 0.080 | 283.9 | 320 (−11.3%) |
- For each row, ε = ΔL / 50 and σ = F / 78.54, and the line gives 200,000·ε. In the sixth row, ε = 0.060 / 50 = 0.0012 and σ = 18,850 / 78.54 = 240.0 MPa, which matches the 240 MPa of the line.
- In the seventh row, the line predicts 280 MPa and the test gave 273.7 MPa. The deviation is (273.7 − 280) / 280 = −2.2%, which is outside the criterion.
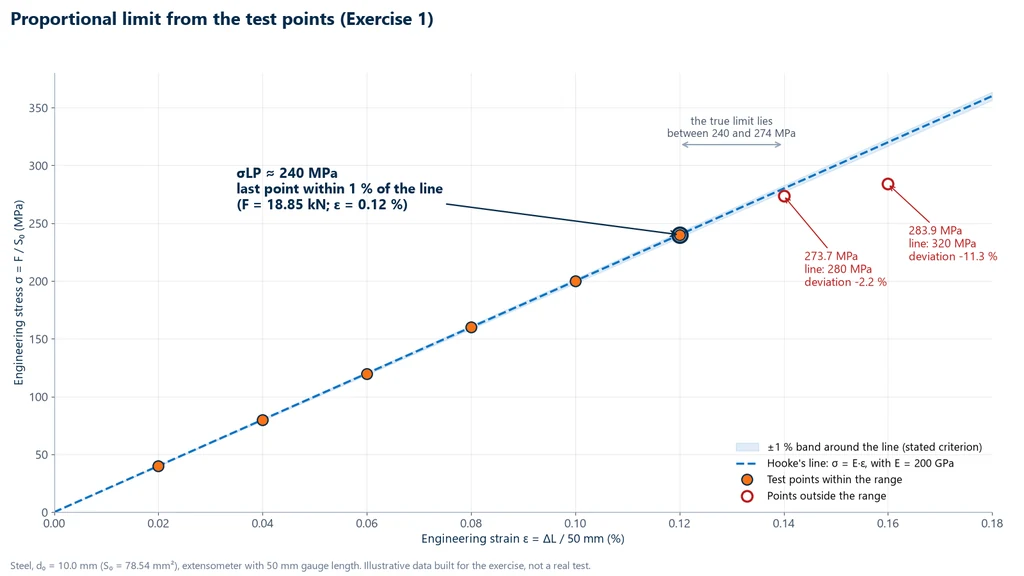
- The last point within 1% is the one at F = 18.85 kN. Therefore, σPL ≈ 240 MPa.
The true value lies somewhere between 240 and 274 MPa, and narrowing that range requires denser data acquisition. With a 3% criterion, the 273.7 MPa point would also pass and the limit would rise to 274 MPa. This is exactly the effect described in the note in ASTM E6. The chart below plots the eight points over the Hooke's law line and the 1% band. The first six fall inside the band, and the last two, shown in red, fall below it.
Example 2: modulus of elasticity in the linear region
Using the graphical method of ASTM E111, take the two points farthest apart in the linear region of example 1: (3.14 kN; 0.010 mm) and (18.85 kN; 0.060 mm).
- Δσ = (18,850 − 3,140) N / 78.54 mm² = 200.0 MPa.
- Δε = (0.060 − 0.010) / 50 = 0.0010.
- E = 200.0 / 0.0010 = 200,000 MPa = 200 GPa, which is consistent with the 207 GPa for steel in Table 6.1 of Callister.
Example 3: modulus of resilience
With σPL = 240 MPa and E = 200,000 MPa: Ur = 240² / (2 × 200,000) = 57,600 / 400,000 = 0.144 MJ/m³ (0.144 MPa). If the calculation used Rp0.2, which is higher than σPL, the result would increase. That is why textbooks call this substitution an approximation.
Example 4: Hooke's law applies only below the limit
An aluminum bar with E = 69 GPa and length L = 200 mm is loaded to σ = 100 MPa. We assume that the proportional limit of the alloy is above 100 MPa, which has to be confirmed by testing.
- ε = 100 / 69,000 = 1.449×10⁻³.
- δ = ε·L = 1.449×10⁻³ × 200 = 0.29 mm.
If the stress went past the proportional limit, the same calculation would underestimate the elongation, because the real curve lies below the line.
Example 5: why you should not measure from the crosshead
In the same test as example 1, at 15.71 kN (σ = 200 MPa) the extensometer reads 0.050 mm over 50 mm, so ε = 0.0010. Suppose that at the same moment the crosshead reads 0.35 mm for a free length of 50 mm. This value is hypothetical and includes grip slack and machine deflection.
- Strain from the crosshead: 0.35 / 50 = 0.007.
- Apparent modulus: 200 / 0.007 = 28.6 GPa, about 7 times lower than the actual 200 GPa.
When the line is wrong, the point where the curve departs from it also shifts. The three limits at the start of the curve can only be measured correctly with an extensometer.
Standards cited
The table lists the standards cited in this article and their current editions. The ASTM and ISO standards link to their official pages. The ABNT standards are Brazilian adoptions of international standards or Brazilian national standards.
| Standard | Scope | Edition |
|---|---|---|
| ASTM E6 | terminology for mechanical testing (proportional limit, elastic limit, modulus) | E6-25 |
| ASTM E111 | Young's modulus, tangent modulus and chord modulus | E111-17(2025)e1 |
| ASTM E3076 | slope of the linear region of a test record (SDAR) | E3076-25 |
| ASTM E8/E8M | tensile testing of metals | E8/E8M-25 |
| ASTM D638 | tensile testing of plastics | D638-22 |
| ISO 6892-1 | tensile testing of metals at room temperature | 2019 |
| ABNT NBR ISO 6892-1 | tensile testing of metals at room temperature (Brazilian adoption of ISO 6892-1) | 2024 |
| ISO 9513 | calibration and classification of extensometers | 2012 |
| ABNT NBR ISO 9513 | calibration and classification of extensometers (Brazilian adoption of ISO 9513) | 2013 |
| ABNT NBR ISO 7500-1 | verification of the machine's force-measuring system | 2023 |
| ISO 527-1 | tensile testing of plastics, general principles | 2019 |
| ABNT NBR 8522-1 | static moduli of concrete in compression (Brazilian standard) | 2021 |
| ABNT NBR 7480 | steel bars for reinforced concrete (Brazilian standard) | 2024 |
Testing machine for measuring the proportional limit
Measuring the proportional limit means measuring the start of the curve precisely, and in that region an extensometer is essential. Without one, the linear region comes out with the wrong slope and ends in the wrong place. The Biopdi M2 universal testing machine line comes in 15 capacities, from 200 N to 1,000 kN. It has a class 1 load cell per ABNT NBR ISO 7500-1:2023 (the Brazilian adoption of ISO 7500-1), clip-on extensometers with 25, 50, 80 and 100 mm gauge lengths for small strains, and the BioLab software. The panel below shows the machine, what each part does when reading the linear region, and the grips used.
The universal testing machine in a tensile test
To read the proportional limit, force and elongation have to be measured on the specimen itself, with the stated sensitivity. Each part of the machine has a role in that reading:
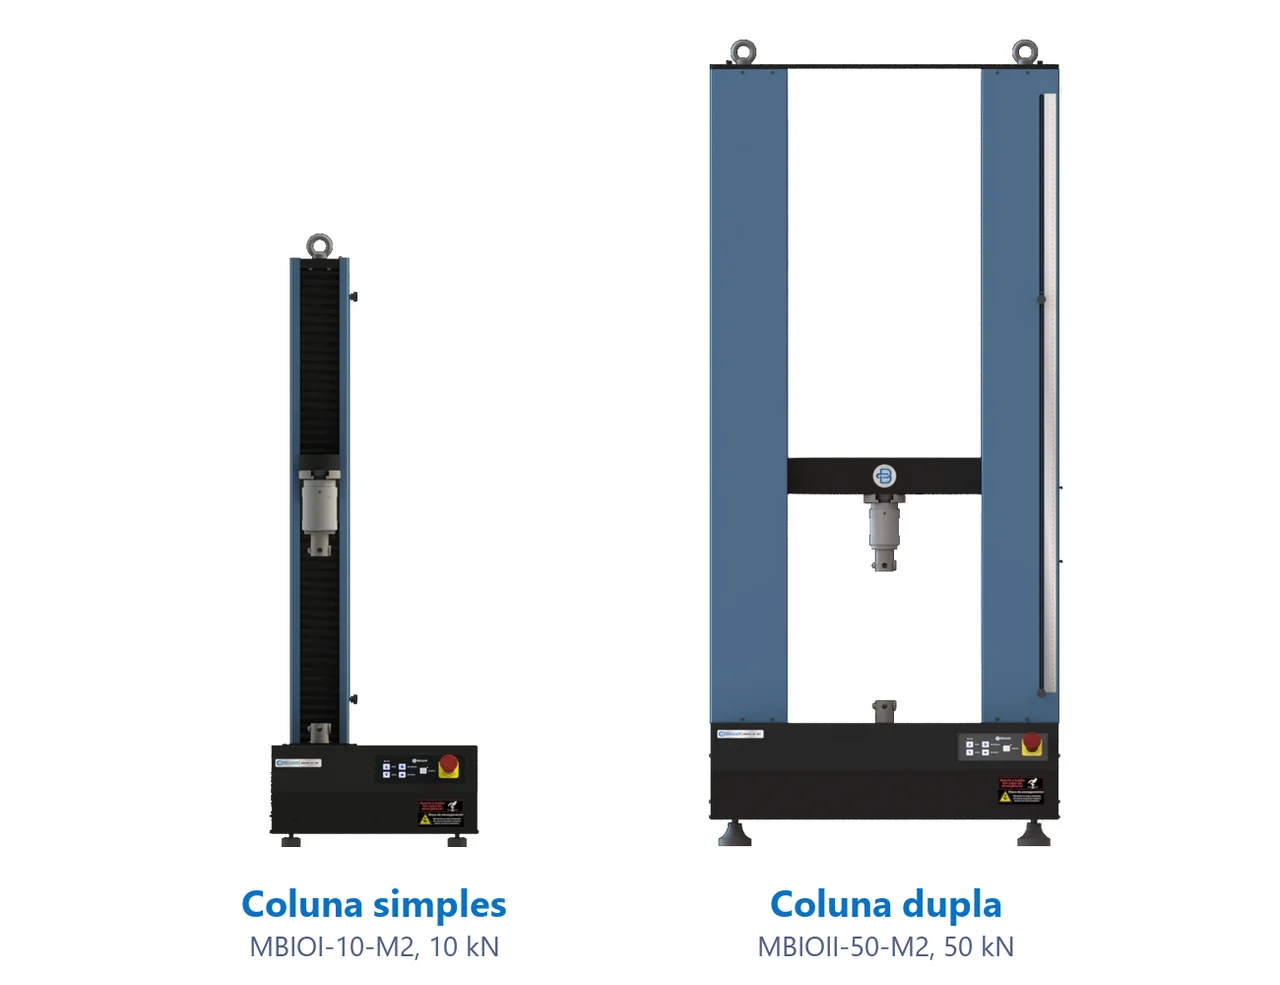
- Clip-on extensometer measures ΔL over gauge length L0, without grip slack: essential for the linear region
- Load cell measures force F, class 1
- Moving crosshead pulls the specimen at a controlled speed
- Wedge grips align the specimen and prevent bending at the start of the curve
- BioLab software converts the data into σ × ε and calculates E and Rp0.2
- Control panel and emergency stop position and stop the test
Fixtures for tensile testing
The fixtures below mount on the same machine, depending on the specimen and the standard:
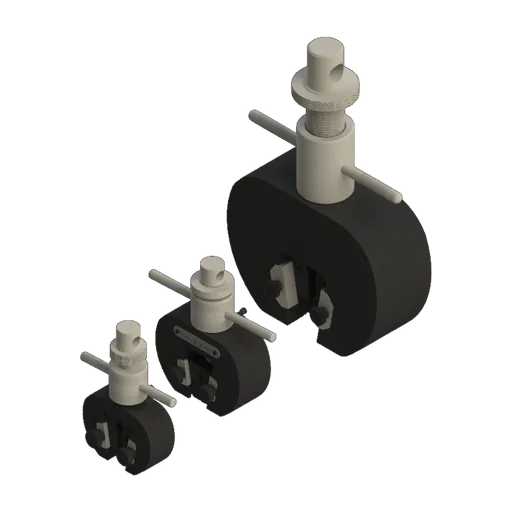 Wedge grip5, 20 and 200 kN
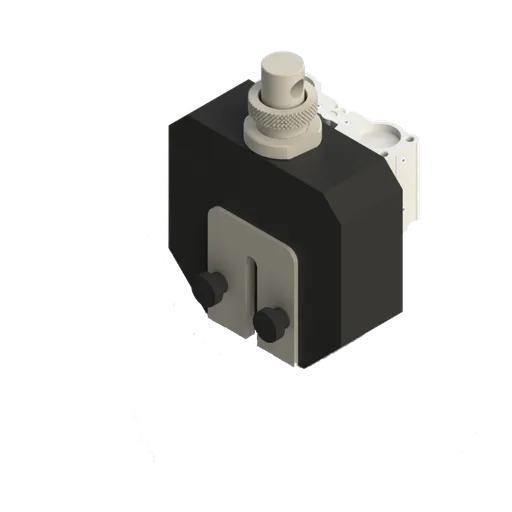 Pneumatic wedge grip50 and 200 kN
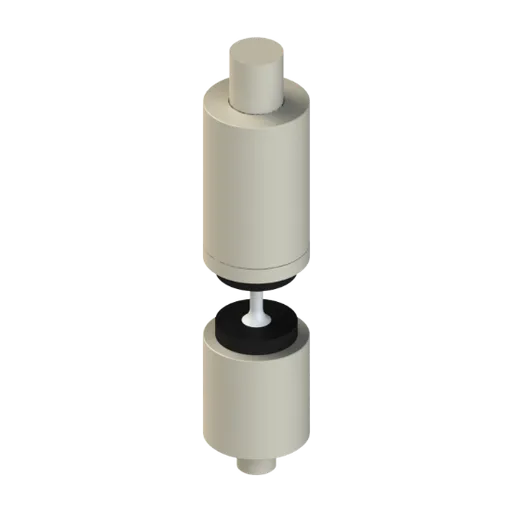 Threaded specimen gripbolts and threaded specimens
For metals, sheet and composites such as the steel in the examples, the recommended model is the 50 kN universal testing machine. For rebar, use the 100 to 200 kN machine. In the BioLab software, custom calculation formulas let you define your own quantities from force, position and extensometer data, such as the deviation from the line in example 1. The other capacities are listed on the universal testing machine page.
Other tests and technical references
Elastic limit and yield strength: what they are, the difference, formula, Rp0.2 and steel table
The elastic limit is the highest stress without permanent strain; yield strength is where plastic strain becomes measurable (ReH and ReL, or Rp0.2). See the formula, symbols, 0.2% offset, steel table, CA-50 and exercises.
Poisson's ratio: what it is, formula, values for steel, concrete and soil, and how to measure it
Poisson's ratio (ν) is the negative ratio of transverse strain to longitudinal strain in a material under uniaxial load in the elastic range. See the formula, its relationship with E, G and K, the range from −1 to 0.5, the values for steel (0.3 per ABNT NBR 8800, the Brazilian steel structures design standard), concrete (0.2 per ABNT NBR 6118, the Brazilian concrete structures design standard), rubber and soils, how to measure it per ASTM E132, and worked examples.
Ultimate tensile strength (Rm): what it is, formula, graph, steel table and how to measure it
Ultimate tensile strength (Rm) is the engineering stress at the maximum force of the tensile test: Rm = Fm/S0. See the symbols, where it sits on the graph, how it differs from yield strength and fracture stress, the steel table with material condition, CA-50 (Brazilian rebar grade), breaking load, the estimate from hardness, and exercises.
Modulus of elasticity (Young's modulus): what it is, formula, units, table of materials and how to measure it
The modulus of elasticity, or Young's modulus (E), is the ratio of stress to strain in the linear elastic region, E = σ/ε, and measures a material's stiffness. See the formula, the units and conversions, a table of E for more than 20 materials, the relationship with G, K and Poisson's ratio, the tangent, secant and chord moduli, and how to measure it with an extensometer.
Frequently asked questions
What is the proportional limit?
In strength of materials, it is the highest stress a material can withstand while stress and strain are still proportional, that is, the end of the linear region of the stress-strain curve (ASTM E6 and ASTM E111). Hooke's law, σ = E·ε, holds up to this point.
What is the difference between the proportional limit and the elastic limit?
The proportional limit marks the end of linearity. The elastic limit is the highest stress that leaves no permanent deformation after unloading (ASTM E6). So the proportional limit is equal to or lower than the elastic limit. In metals the two almost coincide, while in rubber the elastic limit is much higher.
What is the difference between the proportional limit and the yield strength?
The proportional limit is the end of the straight line. Engineering yield strength is a conventional value: the stress at 0.2% plastic strain, Rp0.2 (ISO 6892-1:2019). It is higher than the proportional limit, and it is the value used in standards and design.
Is the proportional limit the same as the yield strength?
No. The order is proportional limit, then elastic limit, then offset yield strength. In a low-carbon steel with a yield plateau the values are close, but they are still different quantities.
Up to what point does Hooke's law apply?
Up to the proportional limit. Beyond it, the curve departs from the line and σ = E·ε no longer holds. ASTM E6 defines the modulus of elasticity as the ratio of stress to strain below this limit.
How do you determine the proportional limit in a tensile test?
Measure strain with an extensometer, fit a line to the initial region, for example by least squares (ASTM E111), and mark the point where the curve deviates from the line by more than a declared criterion, such as a 2% drop in slope. ASTM E3076-25 describes an objective algorithm for finding the linear region.
Why don't standards require the proportional limit?
Because its value depends on the sensitivity of the equipment, load eccentricity and the scale of the plot (ASTM E6). The offset yield strength, Rp0.2, is reproducible, and it is what ISO 6892-1 and ASTM E8/E8M determine.
What is the symbol for yield strength?
In ISO 6892-1, ReH and ReL (upper and lower yield strength) and Rp0.2 (offset yield strength). Textbooks use σy or σe. For concrete reinforcement, fy and fyk; the Brazilian rebar grade CA-50 requires fyk of at least 500 MPa (ABNT NBR 7480:2024, the Brazilian standard for steel reinforcing bars).
Does every material have a proportional limit?
Not a clear one. Gray cast iron and annealed copper have almost no linear region. Plastics use the modulus between 0.05% and 0.25% strain (ISO 527-1), and concrete uses a chord modulus (ABNT NBR 8522-1:2021, the Brazilian standard for the static modulus of concrete).
Do you need an extensometer to measure the proportional limit?
Yes. Crosshead displacement includes grip slack and machine deflection, so the apparent modulus comes out far below the real one. ISO 6892-1 makes an extensometer mandatory for Rp and requires class 1 per ISO 9513.