
The cupping test measures how far a thin metal sheet can be cold formed before it cracks, which is its formability. The sheet is clamped between a die and a blank holder, and a punch pushes it until the first crack appears. In the Erichsen test (ISO 20482), the punch is spherical, 20 mm in diameter, and the depth reached, in millimeters, is the Erichsen index (IE). Other tests in the same family are the Olsen test (ASTM E643), the Swift test, which gives the limiting drawing ratio (LDR), and the Nakazima and Marciniak tests, which produce the forming limit curve (ISO 12004-2).
The cupping test belongs to the people who stamp sheet metal: manufacturers of automotive parts, cans, kitchenware, home appliances and any part made from cold-formed sheet. In this guide you will find the types of cupping tests, how to run the Erichsen test, how it differs from the Olsen test, the r and n coefficients obtained from the tensile test, the Swift test, the forming limit curve, worked examples, common mistakes and the standards in force.
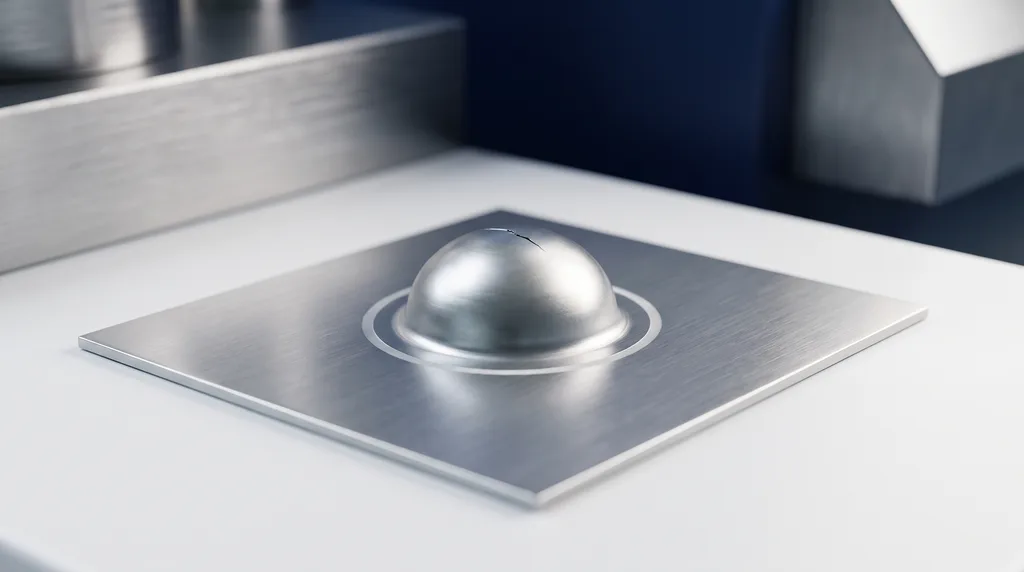
The photo shows the result of an Erichsen test: the punch formed a dome in the center of the sheet, and the test stopped when the first crack went through the thickness at the top of the dome. The height of that dome is the IE index.
What is the cupping test
ISO 20482:2013 defines the purpose of the Erichsen test as determining the ability of metallic sheets and strips 0.1 mm to 2 mm thick, and 90 mm wide or more, to undergo plastic deformation in stretch forming. The idea was patented in 1913 by Abraham Erichsen and is still used for incoming inspection of coils and for production control, because it does not require time-consuming specimen preparation: you just cut a piece of the sheet.
The name comes from the shop floor. Stamping is the set of press operations that turn a flat sheet into a part: blanking, bending and drawing. In drawing, the punch pushes the sheet into the die and it gains depth, as in the body of a can, a cooking pot or a car door panel. The test reproduces this operation on a small scale, with standardized tooling and conditions, to tell before production whether the sheet can make the part. In the press, however, there are two very different forming conditions, and each one has its own test:
- Stretch forming: the flange is held in place and the sheet thins over the punch, stretching in both directions. This is the case of the Erichsen test, the Olsen test, the limiting dome height (LDH) test and the hydraulic bulge test. The governing property is the strain hardening exponent n, which tells how much the metal hardens as it deforms and therefore spreads the strain instead of thinning at a single spot.
- Deep drawing: the flange slides into the die and becomes the wall of a cup. This is the case of the Swift test. The governing property is the normal anisotropy r, which tells how much the sheet resists thinning through its thickness. Both coefficients, n and r, are measured in the tensile test and have their own section further on.
A sheet can perform well in one and poorly in the other. That is why the Erichsen test alone does not predict deep drawing, and the automotive industry uses the forming limit curve, a chart that covers every combination of strains and shows, for each one, how far the sheet can go before it fails.
Two similarly named procedures show up in searches and are not this test. Metallographic mounting is the preparation of a specimen in resin, hot or cold, for grinding and polishing before micrographic examination (see metallography). The embedment strength of wood, from ABNT NBR 7190-3:2022 (the Brazilian standard for test methods on timber), is the force that a steel dowel causes at a specified deformation of the wood divided by the contact area, used in the design of nailed and bolted connections.
Types of cupping test
Cupping tests differ in the shape of the punch, the end criterion and the forming condition they reproduce.
- Erichsen and Olsen are stretch forming tests with a small spherical punch: they give a single number, the dome depth, and are used for incoming inspection and batch control. Each has its own section below.
- Limiting dome height (LDH) uses the same principle with a much larger hemispherical punch, 101.6 mm (4 in), and a specimen that deforms close to plane strain, the most severe condition for the sheet. The result is the dome height at fracture.
- Hydraulic bulge test has no punch: the sheet, clamped at the edge, is pushed by fluid pressure and bulges into a dome. With no tool contact there is no friction, and the test gives the stress-strain curve of the sheet in biaxial tension (ISO 16808).
- Swift is the deep drawing test: it draws cylindrical cups with a flat-bottomed punch and gives the limiting drawing ratio (LDR).
- Fukui, from a Japanese (JIS) standard, does something in between: a conical cup drawn with a spherical punch, combining stretching and drawing.
- Nakazima and Marciniak do not give a single number but the points of the forming limit curve, by forming specimens of different widths.
The table summarizes the punch, the result and the standard of each one:
| Test | Punch | What it measures | Standard |
|---|---|---|---|
| Erichsen | spherical, Ø 20 mm | depth to the first crack (IE, mm) | ISO 20482:2013 |
| Olsen | spherical, Ø 22.2 mm (7/8 in) | cup height at the point of force drop | ASTM E643-24 |
| Limiting dome height (LDH) | hemispherical, Ø 101.6 mm (4 in) | dome height at fracture, close to plane strain | literature (ASME) |
| Hydraulic bulge test | no punch: fluid pressure | biaxial stress-strain curve, without friction | ISO 16808 |
| Swift | cylindrical, flat-bottomed | limiting drawing ratio LDR = D0,max/dp | laboratory method; earing per ISO 11531 |
| Fukui | spherical, conical cup | combination of stretching and drawing | JIS standard |
| Nakazima and Marciniak | 100 mm hemispherical or flat-bottomed | points (ε1, ε2) of the forming limit curve | ISO 12004-2:2021; ASTM E2218-23 |
The diagrams below compare the tooling of the three most requested tests. In the Erichsen and Olsen tests, the sheet is clamped at the edge and the spherical punch forms a dome; in the Swift test, the flat-bottomed punch draws the sheet into the die and forms a cup.
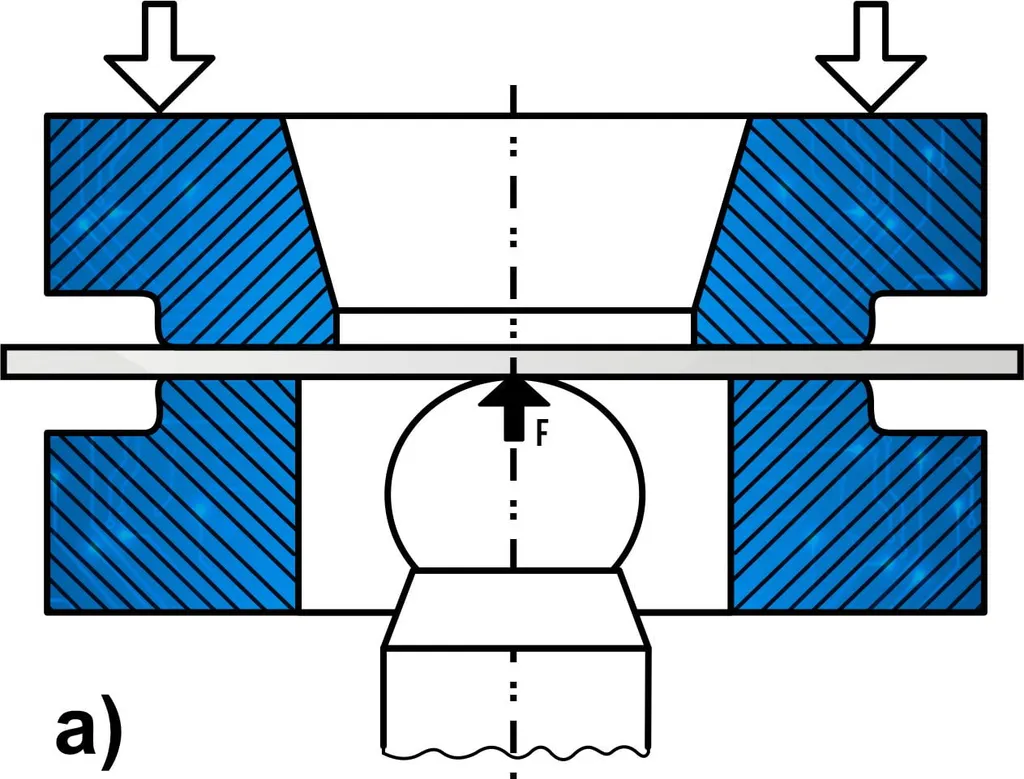
Erichsen test: sheet clamped between die and blank holder, 20 mm spherical punch
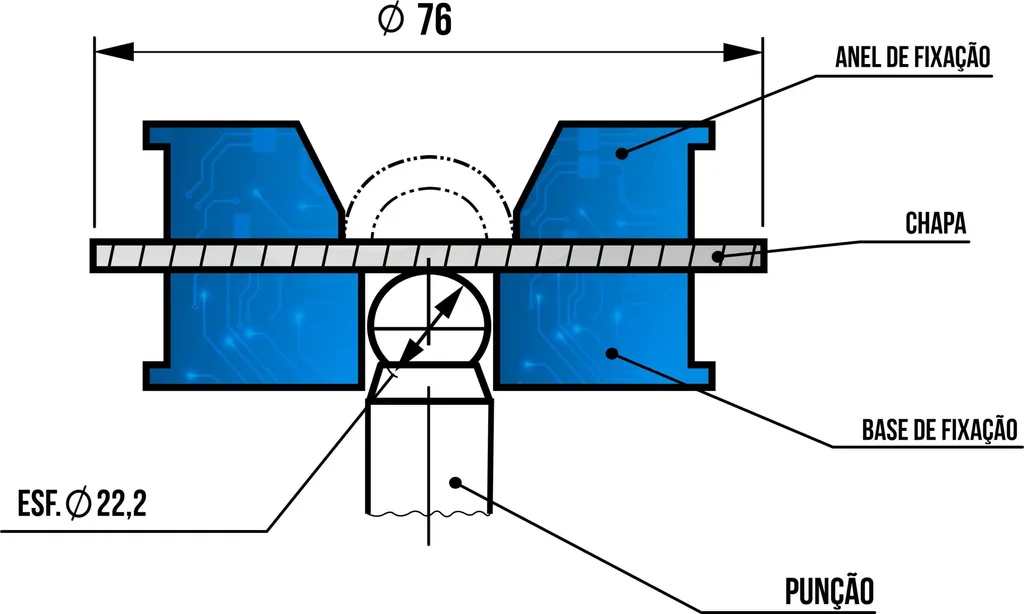
Olsen test (ASTM E643): 22.2 mm (7/8 in) spherical punch
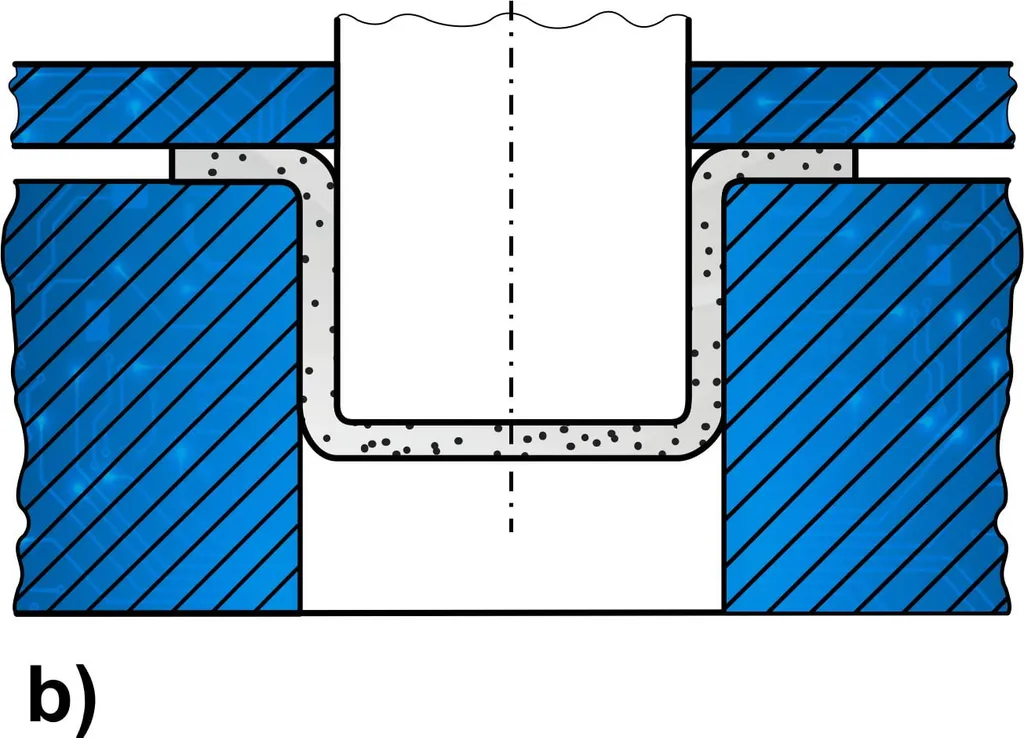
Swift test: a flat-bottomed punch draws a cylindrical cup
Erichsen test: how it is done and the IE index
The Erichsen test is the one most often requested when people talk about cupping tests. The sequence is as follows:
- Test specimen: a flat piece of the sheet at least 90 mm wide, free of cracks, scratches or burrs in the test area. 95 × 95 mm squares are common. The thickness is measured with a micrometer beforehand, because the result depends on it.
- Clamping: the sheet is clamped between the die, with a 27 mm bore in the standard tooling, and the blank holder, with a force of about 10 kN (2,248 lbf); older Brazilian course notes quote 1,000 kgf, which is 9.8 kN.
- Lubrication: the punch and the face of the sheet in contact with it are lubricated as specified by the standard, and the lubricant is recorded in the report.
- Advance: the hardened and polished 20 mm spherical punch advances at 5 to 20 mm/min, forming a dome.
- End: the test stops when a fine, continuous crack appears through the thickness. At that instant, the punch displacement from first contact is the depth h.
- Result: IE is the average of at least three tests, in millimeters.
For thicker sheets or strips narrower than 90 mm, ISO 20482 provides reduced-size tooling, identified by a subscript in the result (for example, IE21). Only indices obtained with the same tooling can be compared.
Typical Erichsen index values
The values below are a reference for drawing-quality steels. DC04 is one of the cold-rolled steel grades for forming, presented in the section on the r and n coefficients.
| Material | Thickness | IE |
|---|---|---|
| DC04 steel | 0.8 mm | 10.98 mm |
| DC04 steel | 1.0 mm | 11.46 mm |
| Low-carbon steels in general | varies | 8 to 14 mm (order of magnitude) |
The table shows the most important point when reading an IE value: it increases with thickness. A 1.0 mm sheet gives a higher index than the same alloy at 0.8 mm, without the material being any better. A minimum IE specification always comes with the thickness.
Olsen test (ASTM E643)
The Olsen test is the American version of the stretch forming test with a spherical punch, standardized by ASTM E643-24 (Ball Punch Deformation of Metallic Sheet Material). The punch is 22.2 mm (7/8 in) and the die has a 25 mm (1 in) bore. The result is the cup height at the point where the force drops, not at the visual appearance of the crack.
Because of the different punch and the different end criterion, Erichsen and Olsen results cannot be converted into each other. If the customer specifies one, that is the test that must be run.
r and n coefficients: the tensile test that predicts formability
Much of a sheet's formability can be predicted in a tensile test by measuring two coefficients. They explain why a sheet performs well in the Erichsen test and poorly in deep drawing, and they are the basis for understanding the Swift test and the forming limit curve in the following sections.
Plastic strain ratio r (Lankford coefficient)
It is the ratio between the true plastic strain in the width and in the thickness (ASTM E517-24; ISO 10113:2020):
r = εw / εt = ln(w/w0) / ln(t/t0)
Since the thickness of thin sheet is hard to measure, constancy of volume is used: εt = −(εL + εw). With r = 1 the sheet is isotropic; with r > 1 it resists thinning and draws better; with r < 1 it thins easily. Since r changes with direction, it is measured at 0°, 45° and 90° to the rolling direction:
- Average normal anisotropy (rm, also written r-bar): rm = (r0 + 2r45 + r90) / 4. It predicts deep drawing (LDR).
- Planar anisotropy: Δr = (r0 + r90 − 2r45) / 2. It predicts earing, the wavy rim of drawn cups.
If r varies with strain, the strain at which it was measured is reported, for example r20. In low-carbon steel it is usually measured between 15% and 20%. The 2020 revision of ISO 10113 introduced the requirement to measure the width reduction along the entire gauge length.
Strain hardening exponent n
It is the exponent of the Hollomon equation, σ = K·εn, with true stress and true strain (ASTM E646-16, reapproved in 2024; ISO 10275:2020). The standard states that n is useful for estimating the strain at the onset of necking: by the Considère criterion, the true uniform strain is approximately equal to n. The higher n is, the more the sheet distributes the strain before thinning at one spot, which favors stretch forming, the Erichsen index and the level of the forming limit curve. In low-carbon steel, the fit is made between 10% and 20% engineering strain, and the discontinuous yielding region is excluded. See also work hardening and ductility.
r and n values of drawing-quality steels (EN 10130)
The European standard EN 10130 classifies cold-rolled steels for forming into grades, from DC01 to DC07, with minimum elongation, r and n. The table lists these minimums in the transverse direction:
| Grade | A80 min. (%) | r90 min. | n90 min. |
|---|---|---|---|
| DC01 | 28 | no minimum | no minimum |
| DC03 | 34 | 1.3 | no minimum |
| DC04 | 38 | 1.6 | 0.18 |
| DC05 | 40 | 1.9 | 0.20 |
| DC06 (interstitial-free) | 41 | 2.1 | 0.22 |
| DC07 (interstitial-free) | 44 | 2.5 | 0.23 |
Source: catalogs of cold-rolled steel to EN 10130 (voestalpine, ArcelorMittal), transverse direction, for thicknesses from 0.5 mm. The yield strength drops from 140 to 280 MPa in DC01 to 100 to 150 MPa in DC07. The progression from DC01 to DC07 is exactly that of r and n: the higher the drawing grade, the higher both values. Aluminum is a different story: the AA6016 T4 alloy has n around 0.30, but rm is usually below 1, which explains why aluminum cannot be drawn as deep as an interstitial-free steel.
In short, each coefficient predicts one forming mode:
| Coefficient | Predicts |
|---|---|
| rm | deep drawing (LDR, Swift test) |
| Δr | earing |
| n | stretch forming (Erichsen, LDH) and FLC level |
Swift test and the limiting drawing ratio (LDR)
The Swift test evaluates deep drawing. Blanks of increasing diameter are drawn with a flat-bottomed cylindrical punch (in the literature, often 50 mm) until the largest blank that becomes a cup without cracking is found. The result is the limiting drawing ratio:
LDR = D0,max / dp
where D0,max is the largest blank diameter drawn without fracture and dp is the punch diameter. High-strength and hot-rolled steels, with average normal anisotropy rm close to 1, have an LDR between 2.0 and 2.2. According to the Advanced High-Strength Steels Guidelines (AHSS Guidelines), the LDR is not very sensitive to strength or to the n value: what increases it is an rm above 1.
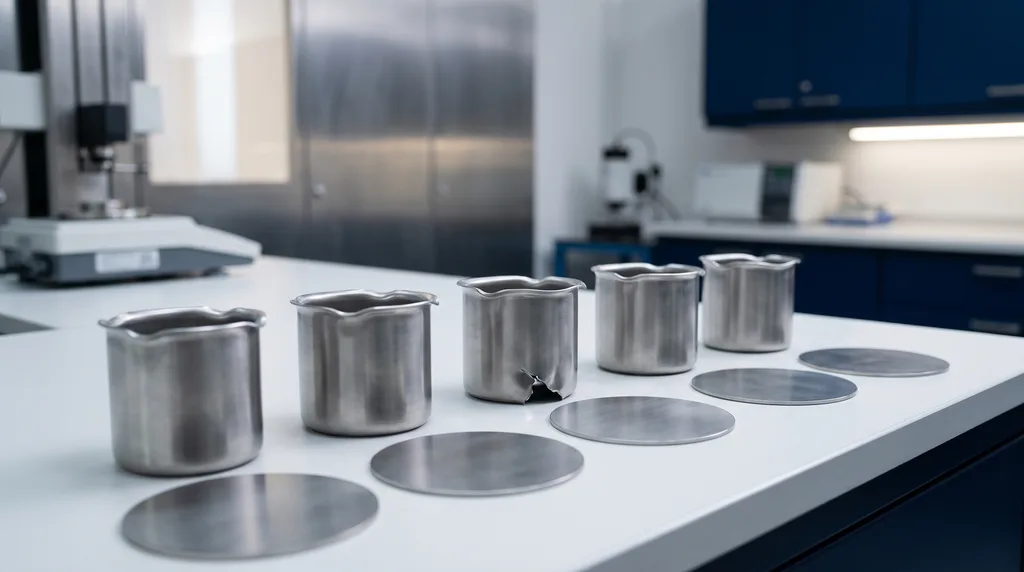
The cup also reveals the planar anisotropy Δr: the rim comes out wavy, with "ears" in directions related to rolling. This is earing, and the earing test on drawn cups is standardized by ISO 11531. In cans and cups, Δr close to zero is ideal, because it eliminates the trimming of the ears. The photo shows drawn steel cups side by side, with the waves on the rim clearly visible.
Forming limit curve (FLC): Nakazima and Marciniak
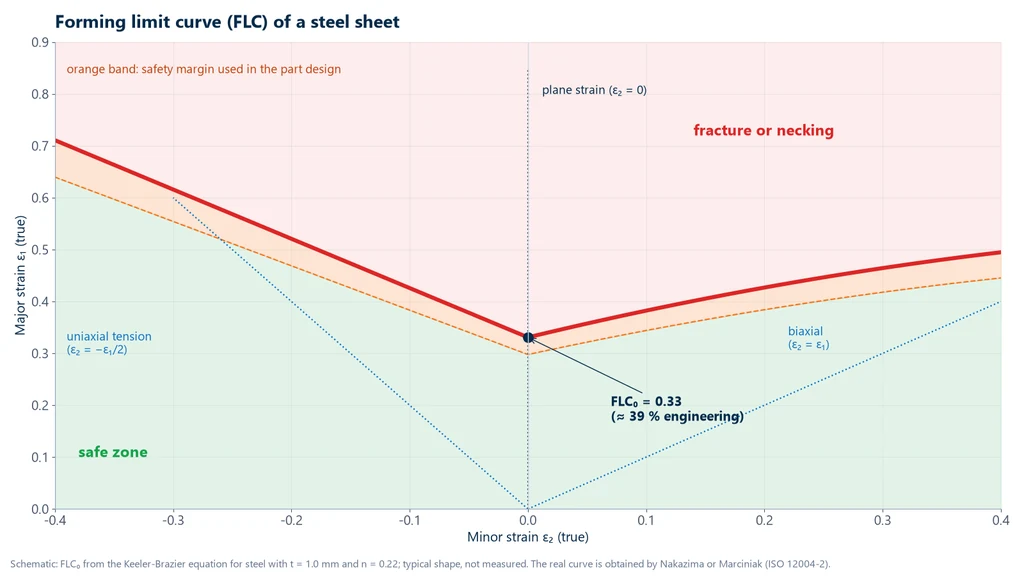
The forming limit curve (FLC; in Portuguese, CLC) is the chart that shows the maximum strain a sheet can withstand before localized necking, for each combination of strains. ASTM E2218-23 defines it as the limiting strain the sheet can sustain under various drawing, stretching and bending conditions without developing localized necking. The chart below shows the FLC of a steel sheet: the vertical axis is the major strain ε1 and the horizontal axis is the minor strain ε2.
How to read the chart:
- Left side (ε2 < 0): tension with lateral compression, as in uniaxial tension and deep drawing.
- Right side (ε2 > 0): tension in both directions, as in the biaxial stretching of the Erichsen test.
- FLC0: the lowest point of the curve, at plane strain (ε2 = 0). This is the most critical condition, and it is where many stamped parts fail.
- Zones: points below the curve are safe; above it, there is necking or fracture. In part design, engineers work with a safety margin below the curve.
How the FLC is determined
- A grid of small circles is marked on the sheet (by electrochemical etching or photogrid), or a stochastic pattern is applied for 3D optical measurement by digital image correlation (DIC).
- Test specimens of different widths are formed, producing strain paths from uniaxial tension to equibiaxial tension. ISO 12004-2 requires at least 5 geometries, with 3 specimens each.
- In the Nakazima method, the punch is hemispherical, 100 mm in diameter; it is the most widely used. In the Marciniak method, the punch is flat-bottomed with an intermediate carrier blank (washer), which eliminates friction and bending at the center of the specimen.
- The circles become ellipses: ε1 = ln(a/d0) and ε2 = ln(b/d0), where a and b are the major and minor axes and d0 is the initial diameter. ISO 12004-2:2021 evaluates the limit strain from the strain profile near the crack.
The FLC is an input to sheet metal forming simulations (AutoForm, PAM-STAMP, LS-DYNA) and the basis of circle grid analysis on real parts, which shows how close each region is to failure. One limitation: in multi-stage forming, with changes in the strain path, ASTM E2218 warns that the limits may not match the measured curve.
For steels, an empirical estimate of the lowest point is the Keeler-Brazier equation:
FLC0 (%) = (23.3 + 14.13·t) · n / 0.21
with t in millimeters and FLC0 in engineering strain. It shows that thicker sheets and sheets with higher n have a higher curve. The equation applies to steels only.
Worked examples: cupping test
Example 1: Erichsen index and LDR. Three Erichsen tests on a 1.0 mm DC04 sheet gave 11.3, 11.5 and 11.6 mm. In the Swift test, with a 50 mm punch, the largest blank drawn without cracking was 108 mm.
IE = (11.3 + 11.5 + 11.6) / 3 = 11.47 mm, consistent with the 11.46 mm reported in the literature for this steel. LDR = 108 / 50 = 2.16.
Example 2: r from the tensile test. Specimen at 0° to the rolling direction: L0 = 50.0 mm and w0 = 12.5 mm. At 20% elongation, Lf = 60.0 mm and wf = 11.2 mm.
εw = ln(11.2/12.5) = −0.1098; εL = ln(60/50) = 0.1823; εt = −(0.1823 − 0.1098) = −0.0725. r0 = 0.1098 / 0.0725 = 1.51.
Example 3: average r and Δr. r0 = 1.80, r45 = 1.50 and r90 = 2.20.
rm = (1.80 + 2 × 1.50 + 2.20) / 4 = 1.75: good deep drawability. Δr = (1.80 + 2.20 − 2 × 1.50) / 2 = +0.50: with a positive Δr, ears form at 0° and 90° to the rolling direction.
Example 4: n and K from two points. On the true stress-strain curve, ε = 0.10 at σ = 420 MPa and ε = 0.20 at σ = 484 MPa.
n = ln(484/420) / ln(0.20/0.10) = 0.1418 / 0.6931 = 0.205. K = 420 / 0.100.205 = 420 × 1.602 = 673 MPa. Check: 673 × 0.200.205 = 484 MPa. The expected true uniform strain is about 0.20, or 22.7% engineering uniform elongation.
Example 5: FLC0 of a steel sheet. t = 1.0 mm and n = 0.22.
FLC0 = (23.3 + 14.13 × 1.0) × 0.22 / 0.21 = 39.2%, or 0.331 in true strain. This is the point marked on the forming limit curve chart in the previous section.
Common mistakes in the cupping test
- Comparing IE values from different thicknesses. The index increases with thickness. Always compare at the same thickness and with the same tooling.
- Wrong blank holder force. Too little force lets the flange slip and the test turns into drawing, with an inflated IE. Too much force fractures the sheet at the die edge.
- Non-standard lubrication. Friction on the punch shifts the crack location. Use the lubricant specified by the standard and record it in the report.
- Subjective crack criterion. The end point is the first fine, continuous crack through the thickness, not necking. The difference between the two heights can reach 8%.
- Converting Erichsen to Olsen. Different punches and criteria: the numbers cannot be converted.
- Using IE to predict deep drawing. The Erichsen test measures stretching. Deep drawability depends on rm.
- Measuring r only at 0°. rm and Δr require r0, r45 and r90, and the strain at which r was measured must be stated in the report.
- Calculating n including the yield point elongation. ASTM E646 excludes the discontinuous yielding region.
- Applying Keeler-Brazier to aluminum or applying the FLC to multi-stage forming with a non-linear strain path.
- Confusing it with metallographic mounting. In Portuguese, the same word (embutimento) also means mounting a sample in resin, which is specimen preparation for micrography, not a formability test.
- Treating the cupping test as a test for polymers and ceramics. Ceramics cannot be cold formed. The Erichsen index, the LDR and the forming limit curve are results for thin sheet metal. On plastic films, punch testing measures force and displacement up to film rupture, and is not interpreted as formability.
Cupping test standards
The table lists the standards cited throughout the article, with the subject of each. Standards are revised and withdrawn: before citing one in a specification or contract, check the current edition.
| Standard | Subject |
|---|---|
| ISO 20482:2013 | Erichsen cupping test on sheet and strip from 0.1 to 2 mm (replaced ISO 8490) |
| ABNT NBR 5902 | Brazilian standard for the cupping index by the modified Erichsen method: withdrawn in October 2011 |
| ABNT NBR 16281:2014 | Brazilian standard for the modified Erichsen method, same title as NBR 5902, thicknesses from 0.3 to 5.0 mm; current, reaffirmed in 2023 |
| ASTM E643-24 | Olsen test (ball punch deformation) |
| ISO 12004-2:2021 | forming limit curve in the laboratory (Nakazima and Marciniak) |
| ASTM E2218-23 | forming limit curve |
| ASTM E517-24 and ISO 10113:2020 | plastic strain ratio (anisotropy coefficient) r |
| ASTM E646-16 (2024) and ISO 10275:2020 | strain hardening exponent n |
| ISO 11531 | earing test on a drawn cup |
| ISO 16808 | biaxial hydraulic bulge test |
| EN 10130 | cold-rolled steels for cold forming, grades DC01 to DC07 with minimum r and n |
Cupping test machine
The Erichsen test is performed on dedicated cupping testers or on a universal testing machine with a cupping fixture: spherical punch, die and blank holder in place of the grips. On the universal testing machine, the load cell records the force and the crosshead displacement gives the depth h. The force drop helps locate the crack, but the standard requires a visible, continuous crack, so direct observation or a camera completes the test. A study from IFRS (Federal Institute of Rio Grande do Sul, Brazil, 2024) performed the modified Erichsen test on 0.36 mm tinplate on a universal testing machine at 0.08 mm/s. The panel below shows the universal testing machine and the role of each part in the cupping test.
The universal testing machine in the cupping test
The M2 line has single-column models, from 200 N to 10 kN, and dual-column models, from 5 kN to 1,000 kN. Each part of the machine has a role in the test:
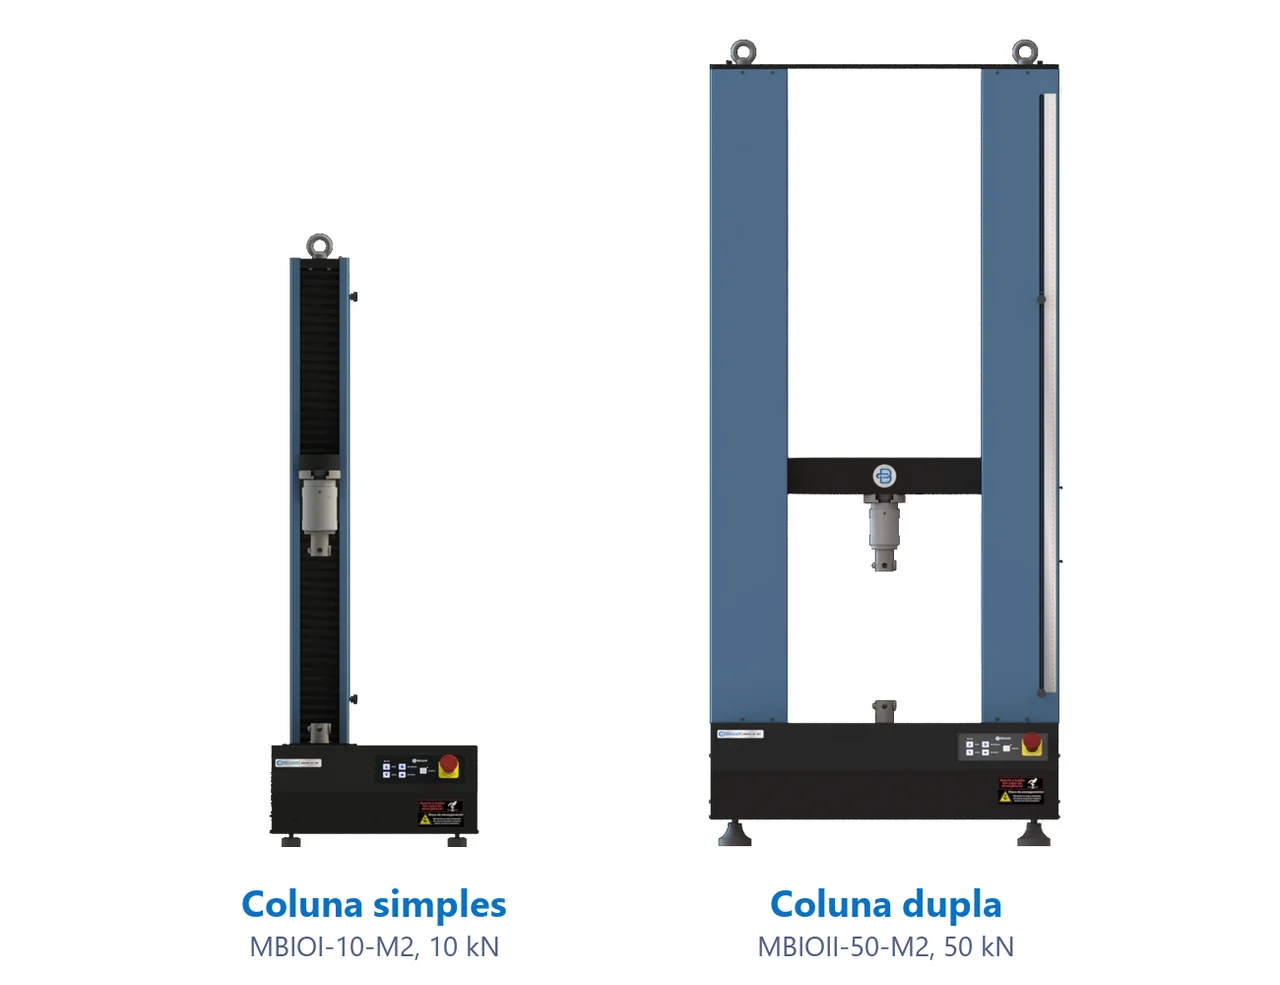
- Moving crosshead advances the punch at 5 to 20 mm/min
- Load cell measures force; the drop indicates the crack
- Fixture spherical punch, die and blank holder
- Depth from displacement: Erichsen index
- BioLab software force vs. depth
- Panel and emergency stop stop the test at the crack
Biopdi's line of universal testing machines performs cupping tests by swapping the grips for a fixture, and Biopdi runs on-demand cupping tests on steel sheet and plastic films. For sheet metal, the 5 to 50 kN range is the starting point, and the right capacity depends on thickness, material and fixture; for films, the 200 N to 1 kN range. The same machine performs the tensile test that gives r and n, and the software calculates both from the curve. For non-standard fixtures, see our special projects or request a quote.
Other tests and technical references
Tests performed on the Biopdi universal testing machine





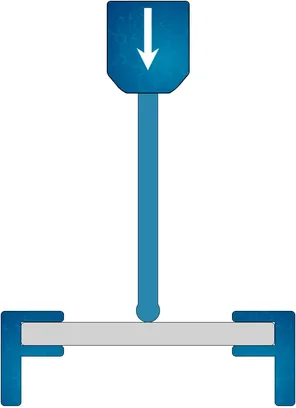
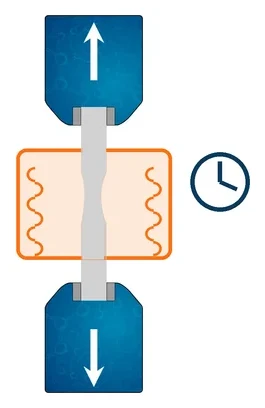


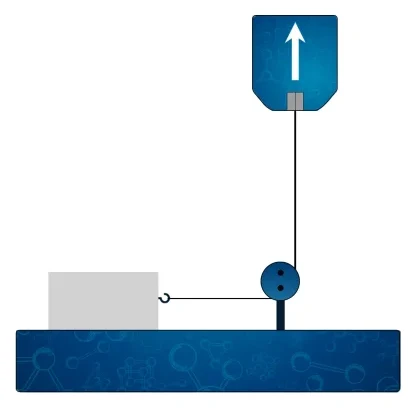
Related technical references
Fatigue testing: S-N curve, fatigue limit, Goodman, Miner's rule and standards
A fatigue test applies cyclic loading to a specimen until failure to obtain the S-N (Wöhler) curve and the fatigue limit. See the cycle parameters, the effect of mean stress, Miner's rule, the standards and the machines.
Peel test: 90°, 180°, T-peel and peel strength calculation
The peel test measures the force per unit width needed to separate bonded materials. See 90°, 180° and T-peel, formula, units and ASTM and ISO standards.
Crush test: ECT, FCT, RCT and BCT
The crush test compresses corrugated board until it collapses. See ECT, FCT, RCT, CMT and BCT, formulas, McKee, 32 ECT in kN/m, standards and examples.
Frequently asked questions
What is a cupping test?
In mechanical testing, it means deforming a clamped sheet with a punch until it cracks, to measure its formability. In Portuguese, the same word (embutimento) is also used in metallography for mounting a sample in resin before polishing.
What is the cupping test used for?
To assess whether a metal sheet can withstand stamping and cold forming: in incoming inspection of coils, in comparing batches and suppliers, and in developing stamped parts.
How is the Erichsen test performed?
The sheet is clamped with about 10 kN between the die and the blank holder, and a 20 mm spherical punch advances at 5 to 20 mm/min until the first continuous crack. The depth reached is the Erichsen index.
What is the Erichsen index (IE)?
It is the depth of the dome, in millimeters, at the onset of the first crack, calculated as the average of at least three tests (ISO 20482). A 1.0 mm DC04 steel gives about 11.5 mm.
What is the difference between the Erichsen and Olsen tests?
The Erichsen test uses a 20 mm punch and stops at the crack; the Olsen test (ASTM E643) uses a 22.2 mm punch and measures the height at the point of force drop. The results cannot be converted.
What is the Swift test?
It is a deep drawing test in which blanks of increasing diameter are formed into cylindrical cups. The largest blank that draws without cracking, divided by the punch diameter, is the limiting drawing ratio (LDR).
What is the forming limit curve?
It is the chart of major strain versus minor strain that marks the limit before localized necking. Below the curve the part is safe; above it, it fails. It is determined by the Nakazima or Marciniak methods (ISO 12004-2).
What kind of tests are Erichsen and Nakazima?
They are formability tests for sheet metal. The Erichsen test gives a single number; the Nakazima test gives the points of the forming limit curve.
What is the plastic strain ratio r?
It is the ratio between the true strains in the width and in the thickness of a tensile specimen. With r greater than 1, the sheet resists thinning and can be drawn deeper.
What does the n exponent indicate in sheet forming?
The ability to work harden and distribute strain. In tension, n is approximately the true uniform strain, and a high n favors stretching and raises the forming limit curve.
Is NBR 5902 still valid?
No. ABNT NBR 5902 (a Brazilian standard) was withdrawn in October 2011. The international reference for the Erichsen test is ISO 20482:2013, and ABNT NBR 16281:2014, current and reaffirmed in 2023, covers the modified Erichsen method on sheets from 0.3 to 5.0 mm.
Can the cupping test be performed on a universal testing machine?
Yes, with a fixture consisting of a spherical punch, die and blank holder. The machine records force and displacement, and the crack is confirmed visually, as the standard requires.