
Yield strength is the stress at which a metal starts to deform plastically by a measurable amount. It is measured in MPa: the minimum is 250 MPa for ASTM A36 structural steel, and the characteristic value is 500 MPa for CA-50 rebar (the Brazilian reinforcing bar grade). Product standards guarantee this number, and design uses it as the upper bound for service stress. It is also called yield stress or yield point (yield strength is the usual term in specifications; in Portuguese it is tensão de escoamento, or tensão de cedência in Portugal). In reinforced concrete its symbol is fy. In steel with a yield plateau, there are two values: the upper yield strength (ReH) and the lower yield strength (ReL). In other metals, the proof strength Rp0.2 is used, which is the stress that leaves 0.2% plastic strain (ISO 6892-1, published in Brazil as ABNT NBR ISO 6892-1:2024). In every case, Re = Fe / S0, in MPa.
In short:
- Reference values: ASTM A36 ≥ 250 MPa; CA-50 rebar fyk ≥ 500 MPa; SAE 1020 is about 205 to 210 MPa hot rolled and about 350 MPa cold drawn; SAE 1045 is about 310 MPa hot rolled and about 530 MPa cold drawn.
- One steel, several yield strengths: the value depends on the material condition (hot rolled, cold drawn, annealed, quenched and tempered) and on the bar size, not just on the chemical composition.
- Design and purchasing: use the minimum guaranteed by the product standard or the mill certificate, never a typical value from a table.
- Measurement: ReH and ReL come from the force alone; Rp0.2 and Rt0.5 require an extensometer.
This article treats yield strength as a specification value. It covers how the standards define and measure it, the minimums each product standard requires, why different tables give different values for the same steel, and how the value is used in design. The test itself is covered in the article on the tensile test.
What yield strength is and why it is the design value
When a metal is pulled in tension, it first deforms elastically: the bonds between atoms stretch and return to their original position when the force is removed. Above a certain stress, planes of atoms begin to slip over one another. This slip happens through the movement of line defects in the crystal lattice, called dislocations, and part of the deformation becomes permanent. This is the onset of plastic deformation, and the stress at which it becomes measurable is the yield strength.
The word "measurable" is what makes yield strength an engineering number. The exact onset of plasticity depends on how sensitive the instrument is. For that reason, ISO 6892-1 does not try to find it. Instead, it defines criteria that any laboratory can reproduce. If the steel shows a force peak followed by a drop, the peak and the plateau are measured. If it does not, a conventional plastic strain is chosen, usually 0.2%, and the stress at that strain is read. By definition, then, Rp0.2 already includes 0.2% permanent strain.
Three reasons put this number at the center of metal specifications:
- Part function: above yield, a part changes shape and does not recover. A bent shaft, a stretched bolt or a beam with permanent deflection has already failed, even though it has not fractured.
- Reproducibility: when the standard procedure is followed, ReL and Rp0.2 vary little from one laboratory to another. The elastic limit and the proportional limit do not have this advantage.
- Margin before fracture: between yield and the ultimate tensile strength (Rm), a ductile metal can still absorb deformation and gives visible warning before it breaks. Designing to the yield strength leaves this margin intact.
This is why mill certificates for structural steel, rebar and bolts always report the yield strength, and why buyers check it on receipt.
Difference between yield strength, elastic limit and proportional limit
Yield strength is the last of the three limits at the start of the stress-strain curve, and the only one measured by a conventional criterion. The three are often confused. Even automated answers from search engines sometimes define yield strength as "the maximum stress without permanent deformation", which is actually the definition of the elastic limit. Along the curve, the order is:
- the proportional limit marks the end of the linear relationship σ = E·ε;
- the elastic limit marks the end of reversible behavior;
- the yield strength marks the onset of measurable plastic deformation, as defined by convention.
In metals the three are close together, but only yield strength has a standard procedure for routine measurement. A detailed comparison, with the ASTM E6 definitions, is given in the two articles linked above.
Above all three is the ultimate tensile strength, Rm = Fm / S0, which is the stress at the maximum force in the test. Between yield and Rm, a ductile metal is already deforming plastically and work hardening, so the force keeps rising. Yield strength is always lower than Rm and is the basis for sizing ductile parts. Rm is used in the design of brittle materials and in fracture checks.
Yield plateau: ReH and ReL
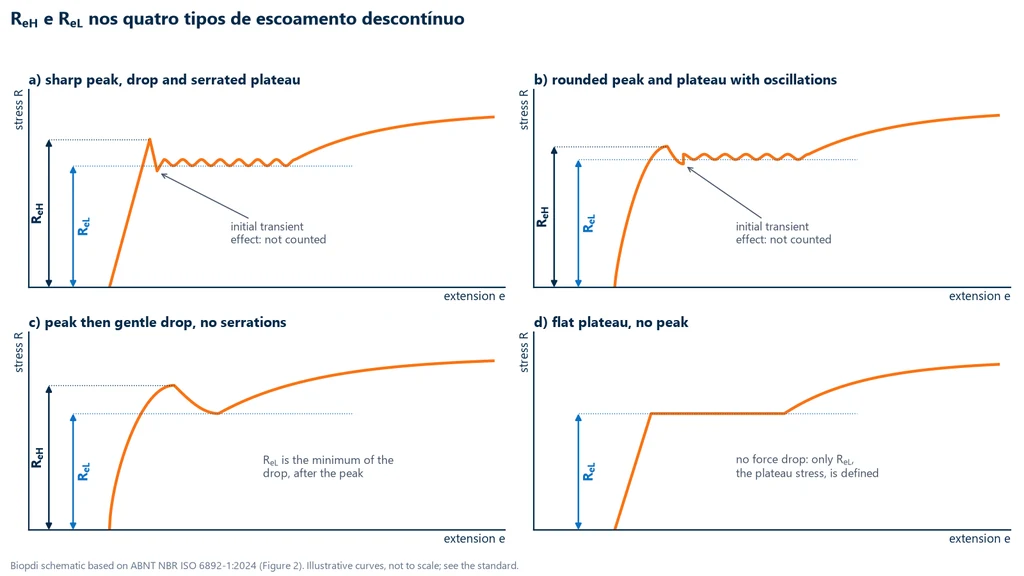
Hot-rolled low-carbon steels such as 1020, hot-rolled 1045, A36 and CA-50 rebar show discontinuous yielding. The force rises in a straight line to a peak and then drops suddenly. After that, the test specimen elongates at almost constant force, with a serrated curve, until work hardening makes the curve rise again. The cause is interstitial carbon and nitrogen atoms that pin the dislocations: freeing the dislocations takes a higher stress than keeping them moving. While this happens, bands of deformation called Lüders bands travel along the gauge length. The mechanism is explained in detail in the article on the elastic limit.
ISO 6892-1 defines two values in this part of the curve:
- ReH, upper yield strength: the stress at the highest force before the first drop (section 11). For testing software, the informative Annex A of the standard recommends taking as ReH a peak that is followed by a force drop of at least 0.5% and by at least 0.05% of strain in which the force does not exceed the peak again.
- ReL, lower yield strength: the lowest stress during plastic yielding, ignoring the transient effects just after the peak. When Ae is not required, the standard allows a simplified procedure, which must be stated in the report: take the lowest stress within the first 0.25% of strain after ReH (section 12).
The diagram below shows how ISO 6892-1 applies these two definitions to the four curve shapes seen in the laboratory. The first three have a force drop: ReH is the peak and ReL is the lowest value on the plateau, not counting the first dip just after the peak, which is a transient effect. The fourth has a flat plateau with no peak, so only ReL is defined.
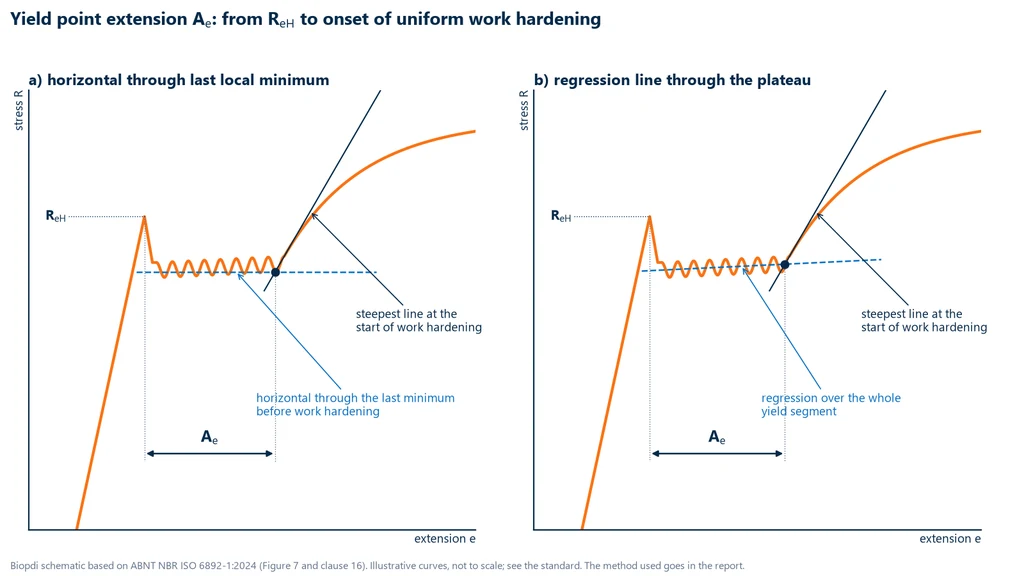
The length of the plateau, from the peak to the start of work hardening, is the yield point extension, Ae. Measuring it requires an extensometer. Measuring ReH and ReL does not, because they depend only on the force.
The end of the plateau is the part that needs a criterion, and ISO 6892-1 gives two, shown in the diagram below. In both, Ae runs from ReH to the intersection with the steepest line at the start of work hardening. They differ in the second line. On the left it is a horizontal line through the last local minimum of the serrations. On the right it is a regression line fitted through the whole plateau. The two values are close but not identical, so the report must state which method was used.
Why ReL is more stable than ReH
The peak is an instability event. ReH rises with loading rate and is sensitive to specimen alignment, surface finish, stress concentrations at the grips and the stiffness of the machine and grip assembly. For example, slight bending from misalignment makes one fiber yield before the others, which lowers or removes the peak. The plateau, by contrast, depends on how the bands propagate and changes little with these conditions. This is why materials literature recommends ReL as the yield value for calculations. It is also why ISO 6892-1 controls test speed most tightly in the range where these values are read.
The product standard decides between ReH and ReL
The test standard defines both values. The product specification states which one is compared with the minimum. One Brazilian example and one international example show that the choice varies:
- Rebar (ABNT NBR 7480:2024, the Brazilian standard for steel reinforcing bars): fyk is the characteristic value of the upper yield strength. On hot-rolled bar, the laboratory reads the peak, not the plateau.
- Bolts (ISO 898-1:2013): for property classes 4.6 and 5.6, the specified yield value is ReL. For the quenched and tempered classes, 8.8 to 12.9, it is Rp0.2.
A common practical mistake is comparing a laboratory ReL with a minimum that refers to ReH, or the reverse. Exercise 3 shows a rebar that passes on the upper yield strength but would be rejected if the laboratory reported the lower one.
Continuous yielding: Rp0.2 and Rt0.5
Cold-drawn or cold-rolled steels, quenched and tempered steels, austenitic stainless steels, aluminum and copper pass from elastic to plastic behavior with no peak and no plateau. In cold-drawn steel, cold work has already freed and multiplied the dislocations, so there is no pinning left to overcome. Because the curve has no point where the force stops rising, yield strength is defined by convention, in two ways.
Proof strength Rp0.2 (0.2% offset yield strength)
Rp0.2 is the stress at which plastic extension reaches 0.2% of the extensometer gauge length. To find it graphically, draw a line parallel to the elastic portion, offset by 0.2% along the strain axis. The value is where this line crosses the curve. Three points determine the quality of the result:
- Slope of the elastic portion: the informative Annex A of ISO 6892-1 recommends fitting it by linear regression over a range well below yield, roughly 10% to 40% of the expected Rp0.2. If that range is not representative, the slope should be recalculated with other limits. A wrong slope shifts the parallel line and changes Rp0.2.
- Extensometer: strain must be measured on the specimen, with an extensometer of ISO 9513 class 1 or better (ASTM E83 class B-2 under ASTM E8/E8M-09). Crosshead displacement includes grip seating and the elastic deformation of the machine.
- Speed: up to yield, the standard limits the strain rate because Rp also rises with it, though less than ReH does.
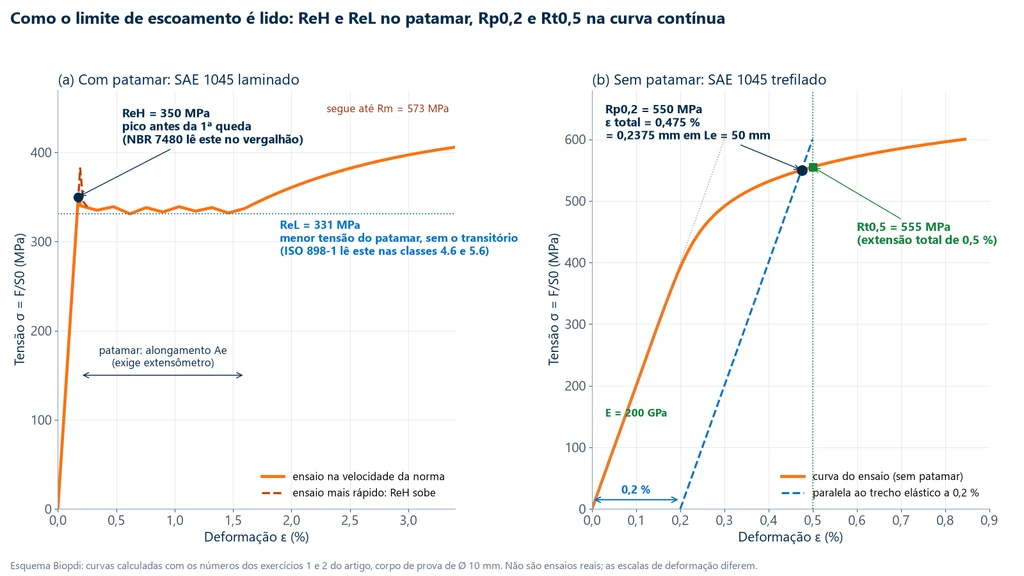
The order of magnitude shows why an extensometer is needed. In a steel with Rp0.2 of 550 MPa and E = 200 GPa, the total strain at that point is 0.275% elastic plus 0.2% plastic, or 0.475%. On a 50 mm extensometer, that is less than a quarter of a millimeter, comparable to the slack in the grips. The step-by-step offset method, including interpolation between data points, is in the article on the elastic limit. The slope used is the modulus of elasticity.
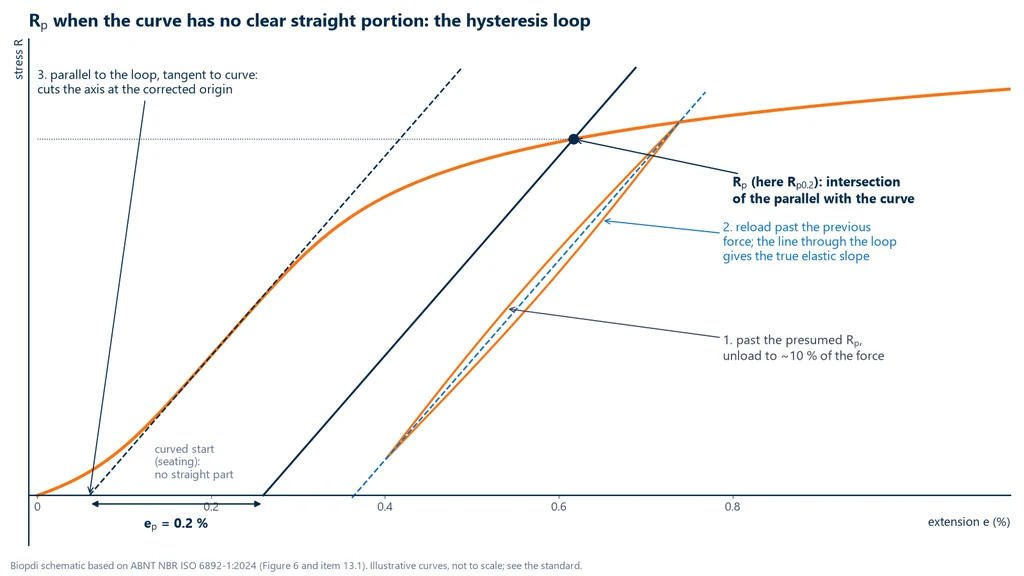
Sometimes the curve has no reliable straight portion, either because of grip seating or because the material departs from linearity very early. Then there is nothing to draw the parallel line from. For this case, ISO 6892-1 recommends the procedure in the diagram below. Once the specimen is past the presumed Rp, it is unloaded to about 10% of the force reached and then reloaded beyond that force. The line through the ends of the hysteresis loop gives the true elastic slope. A line parallel to it and tangent to the curve (one of the methods the standard mentions) marks the corrected origin on the axis. Rp is then read from the parallel line offset by 0.2% from this corrected origin. The loop should be made just after Rp, because its slope changes at larger extensions. In the diagram, it appears to the right of the curve.
Stress at total extension Rt0.5
Rt uses total extension, elastic plus plastic, so no parallel line is needed: Rt0.5 is the stress read when the extensometer shows 0.5% extension. It is simpler to automate and does not depend on the measured modulus, which is why it appears in pipe specifications and in production control. It is equivalent to the extension-under-load method in ASTM E8. ABNT NBR 7480:2024 allows 0.5% extension under load as an alternative for rebar yield strength, but if the results disagree, the 0.2% permanent strain criterion governs.
The two criteria give similar results when the elastic strain at yield is around 0.3%. At 550 MPa it is 0.275%, so 0.5% total extension leaves about 0.22% plastic strain, only slightly more than the 0.2% used for Rp0.2. In materials with a low modulus or a very high yield strength, the elastic strain is larger and the two values move apart. In the extreme case, a steel with a yield strength above about 1,000 MPa has more than 0.5% elastic strain, and Rt0.5 would still fall in the elastic range.
The diagram below shows all four values, using the numbers from exercises 1 and 2. On the left is hot-rolled 1045. Its ReH peak is 350 MPa and its plateau gives an ReL of 331 MPa. The dashed line shows the higher peak the same steel would give in a faster test, with the plateau almost unchanged. On the right is cold-drawn 1045, on an enlarged strain scale. The 0.2% offset line crosses the curve at 550 MPa, and the 0.5% vertical line meets it at 555 MPa. The two points are so close that they almost touch in the graph below.
How yield strength is measured in the tensile test
Yield is obtained from a uniaxial tensile test on a universal testing machine, following ISO 6892-1:2019 (adopted in Brazil, identically, as ABNT NBR ISO 6892-1:2024) or ASTM E8/E8M-25. The differences between the two standards in specimen, testing speed and symbols are covered in the article ASTM E8 vs ISO 6892-1. For yield, five points matter. They are listed here in the order they happen in the lab.
- Original cross-sectional area S0: on a machined specimen, measure it with a micrometer at more than one position, because a 1% error in area becomes a 1% error in yield. For rebar, NBR 7480 (the Brazilian standard for steel reinforcing bars) requires the area of a cylinder with the same mass per meter as the bar, A = m' / 7,850, not the diameter measured over the ribs.
- Extensometer: required for Rp, Rt and Ae. It is not needed for ReH and ReL.
- Speed up to yield: in ISO method A (strain rate control), ReH and Rp are measured in ranges 1 or 2 (0.00007 or 0.00025 s⁻¹, with a ±20% tolerance; range 2 is recommended), and ReL in ranges 2 or 3. In method B (stress rate control), steel is loaded at 6 to 60 MPa/s in the elastic range, and ReL is read at a strain rate between 0.00025 and 0.0025 s⁻¹.
- Reading: the software finds the peak and the minimum of the yield plateau using the criteria of the standard, or draws the parallel line and calculates Rp0.2. Whoever signs the report should check the curve, because grip slippage causes a force drop that the algorithm can mistake for ReH.
- Report: states which yield value was measured (ReH, ReL, Rp0.2 or Rt0.5), the method and speed range, the area used and, where applicable, whether the simplified ReL procedure was used.
The photo shows a steel test specimen just after fracture in a tensile test. The thinning near the fracture, called necking, shows how much the material yielded before it broke. The yield strength was exceeded much earlier, when permanent deformation began.
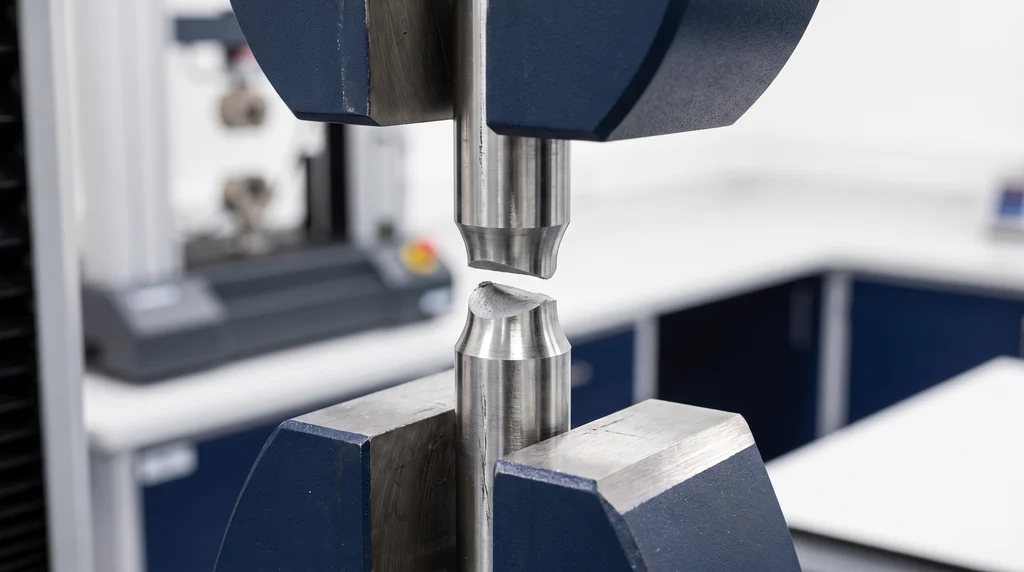
The same test also gives Rm, elongation and reduction of area. Of these properties, though, yield is the only one that is strongly sensitive to testing speed and to the strain measuring device, so it is where two labs most often disagree.
Minimum yield strength by product standard
A product standard turns yield strength into a purchasing requirement. The supplier guarantees that no tested piece falls below the minimum or, for reinforced concrete, that the lot meets a characteristic value. A typical value from a table is a different thing: it is an average, so up to half of the heats can come in below it. Specifications use three types of number:
- Guaranteed minimum: what the standard requires of every tested piece. It is the design and acceptance value (A36, A572, NBR 7007).
- Characteristic value: the fyk of reinforced concrete, which describes the lot (NBR 7480).
- Nominal value: the value that names the class, such as the 900 MPa of a 10.9 bolt. It is not necessarily the acceptance minimum.
The table lists the minimums of the product standards most often consulted in Brazil, along with how each one is read. For structural plates, shapes and bars, ABNT NBR 7007:2022 (the Brazilian standard for structural steels) has grades MR 250, AR 350 and AR 415, which are close to the ASTM steels.
| Product and grade | Standard | Minimum yield strength (MPa) | Note |
|---|---|---|---|
| A36 structural steel | ASTM A36/A36M-19 | 250 | 220 for plate over 200 mm; Rm 400 to 550 |
| MR 250 structural steel | ABNT NBR 7007:2022 | 250 | approximate equivalent of A36 |
| High-strength low-alloy, Grade 50 | ASTM A572/A572M-25 | 345 | grades 42, 55, 60 and 65: 290, 380, 415 and 450 |
| AR 350 and AR 415 structural steel | ABNT NBR 7007:2022 | 350 and 415 | microalloyed; AR 350 COR is weathering steel |
| CA-25 rebar | ABNT NBR 7480:2024 | fyk 250 | plain bar; fst ≥ 1.20·fy |
| CA-50 rebar | ABNT NBR 7480:2024 | fyk 500 | upper yield strength; fst ≥ 1.10·fy |
| CA-60 wire | ABNT NBR 7480:2024 | fyk 600 | no plateau, 0.2%; fst ≥ 1.05·fy and ≥ 660 |
| CA-70 rebar | ABNT NBR 7480:2024 | fyk 700 | fst ≥ 1.10·fy |
| Bolt property class 4.6 | ISO 898-1:2013 | ReL 240 | Rm 400 |
| Bolt property class 8.8 (up to M16) | ISO 898-1:2013 | Rp0.2 640 | above M16: 660 |
| Bolt property class 10.9 | ISO 898-1:2013 | Rp0.2 940 | nominal 900; Rm min. 1,040 |
| Bolt property class 12.9 | ISO 898-1:2013 | Rp0.2 1,100 | nominal 1,080; Rm min. 1,220 |
CA-50 rebar: upper yield strength and area from mass
CA-50, the most common Brazilian rebar grade, is the Brazilian case where yield is most often misread, because of two details in ABNT NBR 7480:2024. The first is the upper yield strength: the note to the properties table defines fyk as the characteristic value of the upper yield strength. The second is the area: stress is calculated with the equivalent area from the measured linear mass, not with the nominal area or the diameter measured over the ribs. The test specimen is the full bar, not machined, with a gauge length of 10 diameters. The standard also requires fst ≥ 1.10·fy and an elongation of 8% over 10φ or an Agt of 5%. Sampling, lots and bend testing are covered in the NBR 7480 guide.
Bolts: nominal is not minimum
In a bolt property class, the first number times 100 is the nominal Rm, and the second number divided by 10 is the nominal ratio of yield to tensile strength. For 8.8, 0.8 × 800 = 640 MPa, and the minimum matches the nominal value up to M16. For 10.9, the nominal value is 0.9 × 1,000 = 900 MPa, but ISO 898-1 requires Rp0.2 ≥ 940 MPa. A report that compares the result with the nominal value will pass a bolt that the standard rejects. Testing of full-size bolts and machined specimens is covered in the ISO 898-1 guide.
Steel values by material condition: 1020, 1045 and 4140
The yield strength of an SAE or AISI steel is not a property of the alloy alone. It depends on the delivery condition and the bar size, so a search for "1020 steel yield strength" or "1045 yield strength" has no answer unless the condition is given. SAE and AISI designations define chemical composition: 1020 has 0.18% to 0.23% carbon and 0.30% to 0.60% manganese. Composition does not guarantee mechanical properties. Yield strength is only guaranteed by a product standard or by the mill certificate for the heat.
SAE steel tables use three types of number, and mixing them up causes the discrepancies found online:
- Estimated minimum: SAE J1397 (1992 revision, stabilized in 2024) publishes estimated minimums for hot-rolled and cold-drawn bars from 19 to 32 mm. It is an informative report, not a purchasing specification, but it is conservative.
- Typical value: averages from ASM Handbook tables, reproduced by distributors. They are higher than the estimated minimums.
- Measured value: the test result for one specific heat. In a study of SAE 1020 sheet (Braz and Pontin, Revista UNIFEB, 2019), the hot-rolled sheet averaged 272 MPa and the cold-rolled sheet 332 MPa.
The table lists values for the most searched steels, always with the condition and the type of value:
| Material and condition | Yield strength (MPa) | Rm (MPa) | Type of value and source |
|---|---|---|---|
| SAE 1020 hot rolled | 205 to 210 | 380 | estimated minimum (SAE J1397) and textbook value |
| SAE 1020 annealed | ≈ 295 | ≈ 395 | typical (ASM) |
| SAE 1020 normalized | ≈ 345 | ≈ 440 | typical (ASM) |
| SAE 1020 cold drawn | 350 | 420 | estimated minimum (SAE J1397) |
| SAE 1045 hot rolled | 310 | 565 to 570 | estimated minimum (SAE J1397) |
| SAE 1045 cold drawn, 19 to 32 mm | 530 | 625 | estimated minimum (SAE J1397) |
| AISI 4140 annealed | ≈ 415 | ≈ 655 | typical (ASM) |
| AISI 4140 normalized | ≈ 655 | ≈ 1,020 | typical (ASM) |
| AISI 4140 quenched and tempered at 540 °C | ≈ 895 | ≈ 1,035 | typical, bar of about 25 mm |
| AISI 4140 quenched and tempered at 205 °C | ≈ 1,640 | ≈ 1,770 | typical, bar of about 25 mm |
| Aluminum 6061-T6 | 276 (min. 240) | 310 (min. 290) | typical and minimum (Aluminum Association) |
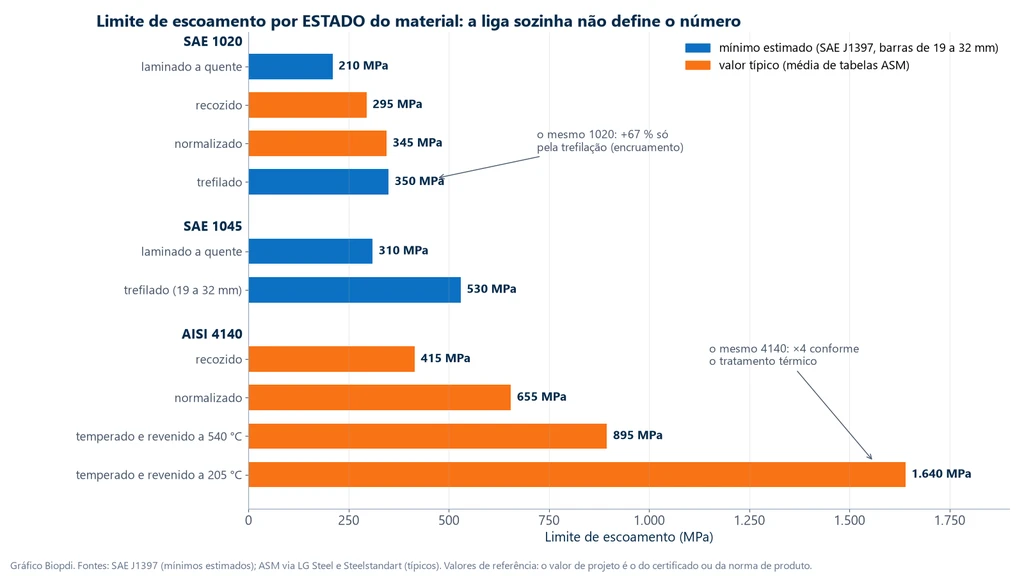
The chart below plots the three steels on the same scale and uses color to separate the SAE J1397 estimated minimum (blue) from the typical value (orange). It makes this section's point visible: within each alloy, the material condition changes yield strength more than switching from one alloy to another. Cold-drawn 1020 yields higher than hot-rolled 1045, and 4140 ranges from 415 to 1,640 MPa through heat treatment alone.
1020 steel: why hot-rolled gives 205 to 210 MPa and cold-drawn about 350 MPa
The value of 205 to 210 MPa with an Rm of 380 MPa, used in textbooks and in the other articles on this site, is for hot-rolled 1020. The bar leaves the rolling mill above the recrystallization temperature, with newly formed ferrite and pearlite grains and few dislocations. SAE J1397 gives the same number as its estimated minimum. ASM tables give a higher typical value, close to 330 MPa, because they describe the average of many heats. Both numbers are correct. For design, use the lower one, since it is what you can expect from any bar.
In cold drawing, the bar is forced through a die at room temperature, and the reduction in cross section multiplies the dislocations, which then block one another. This is work hardening. Yield strength rises to about 350 MPa, 67% above hot-rolled, while Rm only rises to about 420 MPa. Drawing uses up much of the margin between yield and fracture, and the Re/Rm ratio goes from about 0.54 to 0.83. The yield plateau disappears, and yield is then measured as Rp0.2. So the "about 350 MPa" that search engines' automatic answers give for "1020" is the cold-drawn value. Annealing reverses the effect and brings yield back to about 295 MPa. Normalizing, which gives a finer grain, leaves it at about 345 MPa.
1045 steel: the same effect, with more carbon
With about 0.45% carbon, 1045 has more pearlite and yields higher than 1020 in every condition: 310 MPa hot rolled and 530 MPa cold drawn, as estimated minimums. Bar size matters in cold-drawn bar because cold deformation is greater at the surface than at the core, so a thin bar is work hardened more evenly through its section. Reference tables give about 585 MPa for 16 to 22 mm and 485 MPa for 50 to 75 mm. The price of that strength is that 1045 is less ductile and less weldable than 1020.
4140 steel: tempering sets the number
4140 is a chromium-molybdenum alloy steel designed for quenching and tempering. Annealed, it yields at about 415 MPa. Quenching forms martensite, and tempering sets the trade-off: the lower the tempering temperature, the higher the yield strength and the lower the toughness, from about 895 MPa at 540 °C to about 1,640 MPa at 205 °C. In heavy sections the core does not harden the same way, so the actual yield strength drops as diameter increases. A purchase order for 4140 should state the heat treatment condition or the hardness, not just the designation.
What changes yield strength
Anything that hinders dislocation movement raises yield strength. The modulus of elasticity depends on the bonds between atoms and hardly changes at all (see modulus of elasticity of steel). For anyone writing specifications, these factors matter because they explain the gap between the catalog number and the number in the actual part:
- Cold working: drawing, cold rolling and forming raise yield strength and remove the yield plateau. In a bent or stamped part, the deformed region yields higher than the starting material.
- Heat treatment: quenching and tempering raise yield strength, annealing lowers it, and normalizing refines the grain. Localized heating, such as from welding or thermal cutting, can change yield strength in the affected zone.
- Grain size: according to the Hall-Petch relationship, σy = σ0 + ky·d−1/2, yield strength increases as grain size decreases. This is the principle behind niobium and vanadium microalloyed steels such as A572 Grade 50 and AR 350.
- Thickness and bar size: heavy sections cool more slowly and receive less deformation, so product standards lower the minimum for them. A36, for example, drops from 250 to 220 MPa for plate over 200 mm.
- Temperature and speed: yield strength falls as temperature rises and increases with strain rate. Table values apply at room temperature and at the speed set by the test standard.
Yield strength in design: allowable stress, fyd and the Re/Rm ratio
Design does not use yield strength directly. It divides it by a factor that covers the uncertainty in loads, material and calculation model. In allowable stress design, common in mechanical design, σadm = Re / n, where n is the safety factor, and the calculated service stress must not exceed σadm. The safety factor is not a material property. It comes from the design code or industry practice, and it gets larger as the loads get more uncertain.
Reinforced concrete uses limit state design, where the characteristic value is reduced by a partial safety factor for steel: fyd = fyk / γs. With the γs = 1.15 of ABNT NBR 6118 (the Brazilian code for the design of concrete structures) for normal load combinations, CA-50 gives fyd = 500 / 1.15 = 434.8 MPa. In every method, the starting number is the guaranteed minimum or the characteristic value, never a typical value or the result of a single test.
The ratio of yield to tensile strength, Re/Rm, completes the specification. It measures how much the material can still work harden after it yields. With a low ratio, an overloaded region yields, hardens and transfers load to its neighbors, so deformation spreads out before fracture. With a ratio close to 1, fracture follows soon after yield and is concentrated at one point. That is why NBR 7480 requires fst/fy ≥ 1.10 for CA-50, which is equivalent to fy/fst ≤ 0.91. It is a requirement for overall ductility, not for strength. A36 has a typical ratio of 0.65 to 0.75, and 8.8 and 10.9 bolts have ratios of 0.8 and 0.9 by definition of the property class. The same logic applies to sheet metal forming: a low yield strength and a low ratio indicate good formability.
How to interpret yield strength
The questions below come up most often among people who specify, receive or test steel, and nearly all of them come from comparing numbers of different kinds.
The mill certificate shows 320 MPa for an A36. Can I design with 320?
No. The certificate describes the heat that was tested. The standard guarantees 250 MPa, and that is the design value. Mills often ship A36 with a yield strength between 280 and 340 MPa, but your next purchase may come from another heat or another supplier. Designing with the certificate value is only acceptable when the design ties the supply to that specific heat, which is rare.
Which one applies, ReH or ReL, when the order does not say?
The one defined by the product specification, and the report must state which one was measured. If no specification applies, ReL is the conservative and reproducible choice. Comparing results from two laboratories only makes sense with the same criterion: in exercises 1 and 3 of this article, the difference between ReH and ReL is 5.8% and 3.6%, enough to decide a borderline acceptance.
Why do two laboratories measure different yield strengths on the same steel?
The most common causes are testing speed (especially for ReH), the area (nominal diameter instead of measured, or, for rebar, nominal area instead of the area calculated from mass), grip misalignment, Rp0.2 calculated from crosshead displacement, and the location the specimen was taken from in the bar or plate. Differences of a few percent are normal; beyond that, the first step is to compare the curves, not the numbers.
Are SAE 1020 and A36 the same thing?
No. A36 is a product specification, with a guaranteed minimum yield strength of 250 MPa and Rm of 400 to 550 MPa. SAE 1020 is a composition designation, and its yield strength depends on the condition. Both have similar carbon content and may even come from the same mill, but only A36 carries a mechanical guarantee. For structural use, specify A36 or MR 250 (a Brazilian structural grade under ABNT NBR 7007), not "1020".
Does tensile yield strength apply to compression and shear?
In compression, ductile steels yield close to the tensile value, but slender parts fail earlier by buckling, and the proper test is the compression test. In shear, yield strength is lower: by the von Mises criterion, τy ≈ 0.577·σy. Under combined stresses, the comparison with yield strength goes through a yield criterion, never through a single stress.
Does every material have a yield strength?
No. Gray cast iron, ceramics and glass fracture with almost no plastic deformation, and design uses Rm. Polymers have their own "yield", defined by ASTM D638 as the first point at which stress stops increasing, which is not comparable to that of metals; see the ASTM D638 guide.
How to calculate yield strength: worked examples
Yield strength is calculated by dividing the yield force by the original cross-sectional area, Re = Fe / S0; what changes from case to case is which force is read and which area is used. The four exercises follow the order of the article: reading a test with a yield plateau, offset yield strength with an extensometer, acceptance of rebar under NBR 7480 and material selection by guaranteed yield strength. The first two are the ones in the diagram of the section on continuous yielding.
Exercise 1: ReH, ReL and Rm of a hot-rolled 1045
Machined test specimen of hot-rolled SAE 1045, d0 = 10.00 mm. The test records the peak force before the first drop FeH = 27.5 kN, the lowest force on the plateau FeL = 26.0 kN and the maximum force Fm = 45.0 kN. Calculate the three values and compare them with the estimated minimums in SAE J1397.
- Area: S0 = π × 10.00² / 4 = 78.54 mm².
- ReH = 27,500 / 78.54 = 350.1 MPa.
- ReL = 26,000 / 78.54 = 331.0 MPa.
- Rm = 45,000 / 78.54 = 573.0 MPa.
- ReL/Rm = 331.0 / 573.0 = 0.58.
The steel is above the estimated minimums of 310 and 570 MPa. ReH exceeds ReL by 19 MPa, 5.8%: without a specification stating which to report, ReL is reported because it is more stable, and the report states the criterion.
Exercise 2: Rp0.2 and Rt0.5 of a cold-drawn 1045
Same diameter (S0 = 78.54 mm²), extensometer with Le = 50 mm, E = 200 GPa, curve without a plateau. The 0.2% offset line crosses the curve at F = 43.2 kN; at 0.5% total extension the force is 43.6 kN; the maximum force is 50.3 kN. Calculate Rp0.2, Rt0.5 and Rm, and the extension the extensometer read at Rp0.2.
- Rp0.2 = 43,200 / 78.54 = 550.0 MPa.
- Elastic strain at this point: 550.0 / 200,000 = 0.00275; total strain: 0.00275 + 0.002 = 0.00475 (0.475%).
- Extension on the extensometer: 0.00475 × 50 = 0.2375 mm.
- Rt0.5 = 43,600 / 78.54 = 555.1 MPa; at 0.5% total extension the extensometer reads 0.25 mm.
- Rm = 50,300 / 78.54 = 640.4 MPa; Rp0.2/Rm = 0.86.
Rp0.2 meets the estimated minimum of 530 MPa. The ratio of 0.86, against 0.58 in exercise 1, is the cost of work hardening: more yield strength, less reserve. The calculation also shows why the extensometer is needed: the whole criterion fits within less than a quarter of a millimeter. As for the machine, 50.3 kN exceeds the capacity of a 50 kN machine; for cold-drawn or quenched steel at Ø 10 mm, the 100 to 200 kN range is the right one.
Exercise 3: 16 mm CA-50 rebar under NBR 7480
A 0.600 m sample of 16 mm CA-50 bar (the main Brazilian rebar grade) weighs 0.938 kg. In the test, the force at the upper yield strength is 101.5 kN, the lowest force on the plateau is 98.0 kN and the maximum force is 115.0 kN. Does the bar meet the yield strength and fst/fy ratio requirements of ABNT NBR 7480 (the Brazilian standard for steel reinforcing bars)?
- Linear mass: m' = 0.938 / 0.600 = 1.563 kg/m. Deviation from the nominal 1.578 kg/m: −0.9%, within the ±5% tolerance for the bar size.
- Area from mass: A = 1.5633 / 7,850 = 1.9915 × 10⁻⁴ m² = 199.2 mm².
- fy from the upper yield strength: 101,500 / 199.2 = 509.7 MPa ≥ 500 MPa: pass.
- fst = 115,000 / 199.2 = 577.5 MPa; fst/fy = 577.5 / 509.7 = 1.13 ≥ 1.10: pass.
- If the laboratory reported the lower yield strength: 98,000 / 199.2 = 492.1 MPa, below 500, and the bar would be wrongly rejected.
- If it used the 17.4 mm diameter measured over the ribs: A = 237.8 mm² and fy = 426.9 MPa, another wrongful rejection.
The bar meets the tensile requirements; elongation and bend tests are still pending, and lot approval depends on all samples. The maximum force of 115 kN requires a machine above 100 kN.
Exercise 4: selecting the steel for a tie rod by guaranteed yield strength
A round tie rod with a 20 mm diameter carries 50 kN in tension. The design uses a safety factor n = 1.67 (a teaching value; the real one comes from the design code). What minimum yield strength does the steel need, and which options meet it?
- Area: A = π × 20² / 4 = 314.2 mm².
- Service stress: σ = 50,000 / 314.2 = 159.2 MPa.
- Required yield strength: Re ≥ 159.2 × 1.67 = 265.8 MPa.
- Hot-rolled SAE 1020 (≈ 210 MPa): fails. A36 or MR 250 (250 MPa guaranteed): fail by a small margin. A572 Grade 50 or AR 350 (345 and 350 MPa guaranteed): pass.
- Alternative with A36: minimum area 50,000 × 1.67 / 250 = 334 mm², d ≥ 20.6 mm, meaning a 22 mm bar.
Cold-drawn SAE 1020, at about 350 MPa, would also pass on the number, but it has no guarantee without a heat certificate: in design, the yield strength that counts is the one someone guarantees in writing.
Common mistakes
The mistakes below show up frequently in test reports, purchase orders and design calculations:
- Calling yield strength "the maximum stress without permanent deformation": that is the definition of the elastic limit; Rp0.2 already includes 0.2% permanent strain.
- Quoting a yield strength without the material condition: "1020 = 350 MPa" only holds for the cold-drawn condition.
- Treating SAE 1020 or 1045 as a strength specification: they are chemical designations; the mechanical guarantee comes from the product standard or the certificate.
- Designing with a typical value or the certificate value: the design value is the guaranteed minimum or the characteristic value.
- Confusing nominal with minimum: a 10.9 bolt has a nominal value of 900 MPa and a minimum of 940 MPa.
- Reading rebar from the lower plateau or with the nominal area: NBR 7480 uses the upper yield strength, with the area calculated from mass.
- Measuring Rp0.2 from crosshead displacement: grip seating and machine deflection distort the offset line; a class 1 extensometer is required.
- Testing faster than the standard allows: this raises ReH and can pass material that does not comply.
- A report without the criterion: without stating whether it is ReH, ReL, Rp0.2 or Rt0.5, the number cannot be compared with anything.
- Converting units by eye: 1 MPa = 1 N/mm² = 0.1 kN/cm² = 10.197 kgf/cm²; 1 kgf/mm² = 9.807 MPa and 1 ksi = 6.895 MPa. The 250 MPa of A36 is 25 kN/cm², a common unit in Brazilian structural steel tables, and 36 ksi. The "50" in CA-50 comes from kgf/mm², and NBR 7480 accepts 1 MPa ≈ 0.1 kgf/mm² for practical purposes.
Testing machine for measuring yield strength
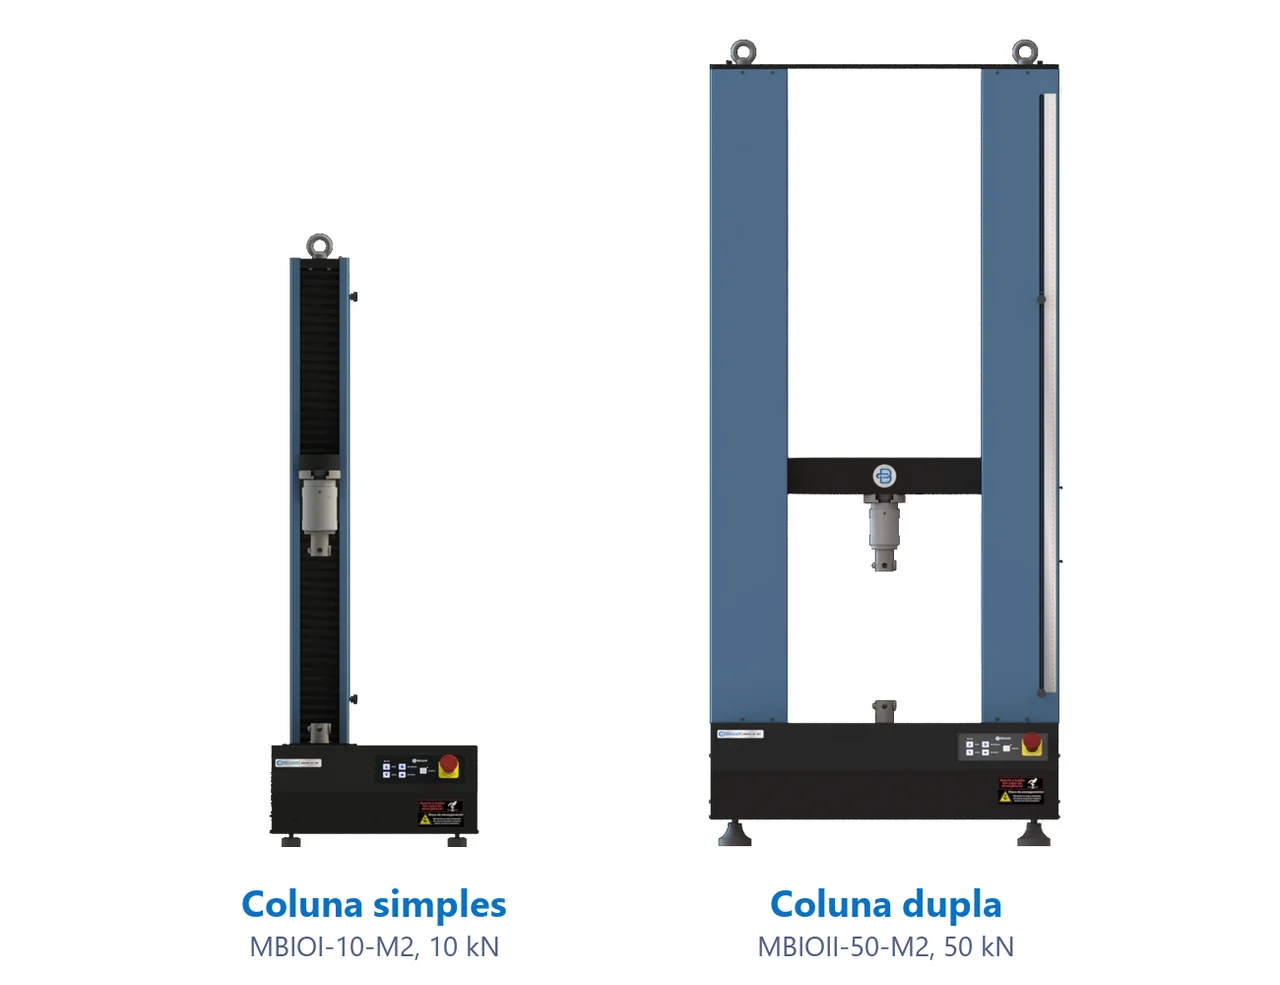
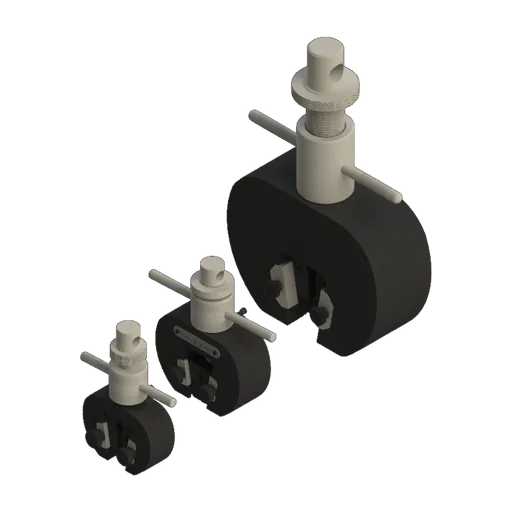
Yield strength is measured on a universal testing machine, and what the machine needs depends on the criterion. ReH and ReL depend only on force: the requirement falls on the load cell, class 1 per ISO 7500-1 (ABNT NBR ISO 7500-1:2023 in Brazil), and on crosshead speed control. Rp0.2 and Rt0.5 also require an extensometer on the specimen. The Biopdi M2 universal testing machine is electromechanical, with class 1 load cells, 25, 50, 150 and 250 mm extensometers and the BioLab software, which plots the stress-strain curve, identifies the peak and the plateau and calculates Rp0.2 with the offset line. The panel below shows the machine, the role of each part in measuring yield strength and the fixtures used.
The universal testing machine in yield strength measurement
The M2 line has single-column models, from 200 N to 10 kN, and dual-column models, from 5 kN to 1,000 kN. Each part of the machine has a role in measuring yield strength:
- Moving crosshead pulls at the speed set by the standard, method A or B
- Load cell class 1: sufficient for ReH, ReL and Rm
- Grips: wedge, pneumatic, threaded or wire grips
- Extensometer required for Rp0.2, Rt0.5 and Ae
- BioLab software divides force by S0, finds the peak and draws the offset line
- Control panel and emergency stop position and stop the test
Fixtures for yield strength measurement
The fixtures below are mounted on the same machine, depending on the specimen and the standard:
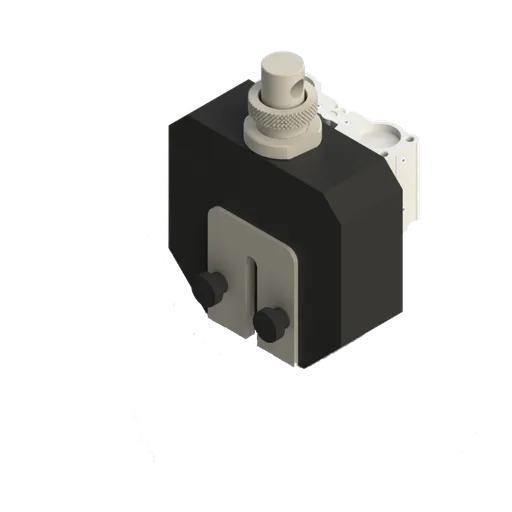
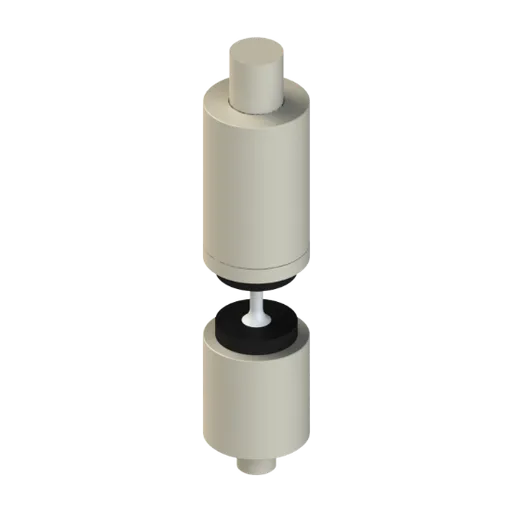
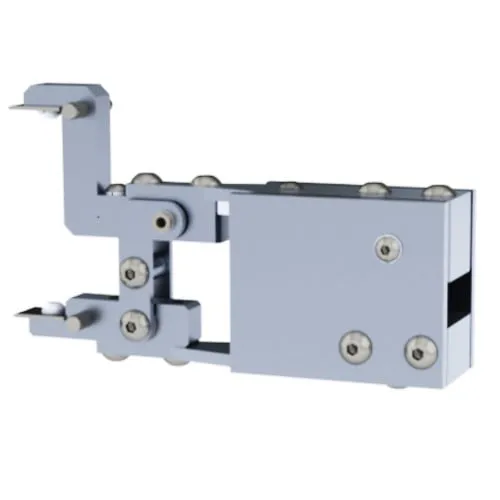
Capacity is chosen by the maximum force, which comes after yielding. Machined low-carbon steel specimens at Ø 10 mm, like the one in exercise 1, fall within the range of the 5 to 50 kN machine (MBIOII-50-M2); cold-drawn or quenched steel at the same diameter and rebar up to 16 mm, as in exercises 2 and 3, call for the 100 to 200 kN machine (MBIOII-200-M2). A 25 mm CA-50 bar, with 490.9 mm² and Rm near 600 MPa, reaches about 295 kN and already requires the 300 kN models or larger. The BioLab software builds the report with the yield criterion used. The other configurations are on the universal testing machine page, and you can request a quote for the bar sizes and materials in your laboratory.
Yield strength standards
The definitions and the method come from the test standards; the minimums, from the product standards. The table lists the ones cited in this article, with the current edition checked on October 1, 2026 in the ISO and ASTM catalogs and on September 30, 2026 in the ABNT and SAE catalogs:
| Standard | Scope | Edition |
|---|---|---|
| ABNT NBR ISO 6892-1 | tensile testing of metals at room temperature (Brazilian adoption of ISO 6892-1): ReH, ReL, Rp, Rt | 2024 |
| ISO 6892-1 | tensile testing of metals at room temperature | 2019 |
| ASTM E8/E8M | tensile testing of metals: offset, extension-under-load, yield point | E8/E8M-25 |
| ISO 9513 | calibration of extensometers (class 1 for Rp and Rt) | 2012 |
| ABNT NBR ISO 7500-1 | verification of the force-measuring system of the testing machine | 2023 |
| ASTM A36/A36M | carbon structural steel | A36/A36M-19 |
| ASTM A572/A572M | high-strength low-alloy structural steel | A572/A572M-25 |
| ABNT NBR 7007 | carbon and microalloyed steels for structural bars and shapes (Brazil) | 2022 |
| ABNT NBR 7480 | steel for reinforced concrete (Brazil) | 2024 |
| ISO 898-1 | mechanical properties of steel bolts | 2013 |
| SAE J1397 | estimated mechanical properties of steel bars (informative) | 1992, stabilized in 2024 |
Other tests and technical references
Tests performed on the Biopdi universal testing machine








Related technical references
Shear modulus (G): what it is, formula, relationship with E and ν, values and how to measure it
Shear modulus (G): the τ/γ ratio in the elastic range, 77 GPa for steel per NBR 8800. G = E/[2(1+ν)], values by material, measured by torsion.
NBR 7480: requirements for CA-25, CA-50, CA-60 and CA-70 rebar steel, table and tests
ABNT NBR 7480:2024 (the Brazilian standard for steel bars and wires for reinforced concrete) sets the requirements for rebar: categories CA-25, CA-50, CA-60 and CA-70, minimum yield strength, fst/fy ratio, elongation, bend test, linear mass and sampling. The test methods come from ISO 6892-1 (ABNT NBR ISO 6892-1 in Brazil) for the tensile test and from ABNT NBR 17005 for the bend test.
ISO 898-1: bolt property classes (8.8, 10.9, 12.9), proof load and testing
ISO 898-1:2013 defines the property classes of carbon steel and alloy steel bolts, from 4.6 to 12.9, and the tests that verify them. See what each number means, the summary table, the stress area of an M12 (84.3 mm²), the breaking and proof loads in kN, the tests and how to choose the testing machine.
Frequently asked questions
What is yield strength?
It is the stress at which a metal starts to deform plastically by a measurable amount. In steel with a yield point plateau, the upper yield strength (ReH) and the lower yield strength (ReL) are measured; in other metals, the proof strength Rp0.2 is used, which is the stress at 0.2% plastic strain (ISO 6892-1, adopted in Brazil as ABNT NBR ISO 6892-1:2024).
What is the yield strength of steel?
It depends on the grade and condition: from about 210 MPa for hot-rolled SAE 1020 to more than 1,600 MPa for 4140 quenched and tempered at a low temperature. Common structural steels guarantee from 250 MPa (ASTM A36 and the Brazilian MR 250) to 350 MPa (A572 Grade 50 and the Brazilian AR 350), and CA-50 rebar (the Brazilian reinforcing bar grade) has an fyk of 500 MPa.
How is yield strength calculated?
Divide the yield force by the original cross-sectional area: Re = Fe/S0, in MPa (N/mm²). Example: 26.0 kN on a test specimen 10 mm in diameter (78.54 mm²) gives 331 MPa. For rebar, the area is calculated from the measured mass per unit length (NBR 7480, the Brazilian standard for steel reinforcing bars).
What is the yield strength of 1020 steel?
It depends on the condition. Hot rolled, about 205 to 210 MPa, with an Rm of 380 MPa; cold drawn, about 350 MPa, with an Rm of 420 MPa (estimated minimums from SAE J1397). Annealed, it is close to 295 MPa, and normalized, close to 345 MPa (typical ASM values). The SAE specification for 1020 covers chemistry only: 0.18% to 0.23% carbon and 0.30% to 0.60% manganese.
What is the yield strength of 1045 steel?
About 310 MPa hot rolled and 530 MPa cold drawn, for bars from 19 to 32 mm (estimated minimums from SAE J1397). In cold-drawn bars the value decreases as the bar size increases, and quenched and tempered 1045 exceeds 690 MPa. The SAE specification for 1045 covers chemistry: 0.43% to 0.50% carbon and 0.60% to 0.90% manganese.
What is the yield strength of CA-50 steel?
The characteristic value fyk is 500 MPa (ABNT NBR 7480:2024, the Brazilian standard for steel reinforcing bars). In hot-rolled bars it is read as the upper yield strength and calculated with the equivalent area obtained from the mass. The standard also requires fst ≥ 1.10·fy and an elongation of 8% over 10φ or an Agt of 5%.
What is the yield strength of 4140 steel?
About 415 MPa annealed and 655 MPa normalized. Quenched and tempered, it ranges from about 895 MPa (tempered at 540 °C) to about 1,640 MPa (205 °C), for bars of about 25 mm; the lower the tempering temperature, the higher the yield strength and the lower the toughness.
What is the yield strength of A36 steel?
The minimum is 250 MPa (36 ksi), and 220 MPa for plates thicker than 200 mm, with an Rm of 400 to 550 MPa (ASTM A36/A36M-19). The approximate Brazilian equivalent is MR 250 from ABNT NBR 7007 (the Brazilian standard for structural steel products).
What is the difference between yield strength and proportional limit?
The proportional limit is the end of the linear relationship between stress and strain (Hooke's law). Yield strength lies above it and marks the onset of measurable plastic deformation, measured as ReH and ReL or as Rp0.2. Only yield strength has a standardized routine measurement.
What is the difference between yield strength and ultimate tensile strength?
Yield strength marks the onset of measurable plastic deformation; ultimate tensile strength (Rm) is the stress at the maximum force of the test, after work hardening. Yield strength is always lower and is the basis for designing ductile parts: for A36, a minimum yield strength of 250 MPa versus an Rm of 400 to 550 MPa.
Which steel is stronger, 1020 or 1045?
In the same condition, 1045, because it has more carbon: 310 versus 210 MPa hot rolled and 530 versus 350 MPa cold drawn (estimated minimums from SAE J1397). However, cold-drawn 1020 yields higher than hot-rolled 1045, and 1020 is more ductile and more weldable.
Which steel is stronger, 1045 or 4140?
4140, in the same condition: annealed, it yields at about 415 MPa versus about 240 MPa for annealed 1045 (typical values), and quenched and tempered it ranges from about 895 to 1,640 MPa. Chromium and molybdenum give 4140 higher hardenability, and quenching reaches the core of thicker bars than in 1045.
What is the difference between 1020 steel and A36?
A36 is a product standard and guarantees a minimum yield strength of 250 MPa and an Rm of 400 to 550 MPa. SAE 1020 defines only the chemical composition (0.18% to 0.23% carbon), and its yield strength depends on the condition; without a mill certificate, there is no guarantee of mechanical properties.
What do ReH, ReL and Rp0.2 mean?
ReH is the stress at the force peak before the first drop; ReL is the lowest stress on the yield plateau, excluding the initial transient effect; Rp0.2 is the stress at 0.2% plastic extension, used when there is no plateau (ISO 6892-1, ABNT NBR ISO 6892-1:2024 in Brazil).
Do you need an extensometer to measure yield strength?
For Rp0.2 and Rt0.5, yes, class 1 per ISO 9513 or better. ReH and ReL can be read from the force alone, but the yield point extension (Ae) requires an extensometer.