
Ultimate tensile strength (Rm) is the engineering stress at the maximum force reached in a tensile test: Rm = Fm / S0, the maximum force divided by the original cross-sectional area of the test specimen. It is the highest point on the stress-strain curve and, in ductile metals, it marks the onset of necking, not fracture.
The result is given in MPa, which is the same as N/mm². One reference value gives the order of magnitude: ASTM A36 structural steel has a specified Rm between 400 and 550 MPa. This article covers the Rm measured in the tensile test. It starts with the definition and the formula, shows where Rm sits on the stress-strain curve, separates Rm from yield strength and fracture stress, gives values for steel and other materials along with the condition of each, and ends with worked examples and the testing equipment.
What is ultimate tensile strength (Rm)
The reference definition is in ISO 6892-1 (ABNT NBR ISO 6892-1:2024 in Brazil). The standard defines the maximum force, Fm, as the highest force the test specimen withstands during the test, and defines tensile strength, Rm, as the stress corresponding to that force. Every stress in the standard is an engineering stress: the force divided by the original cross-sectional area, S0, measured before the test.
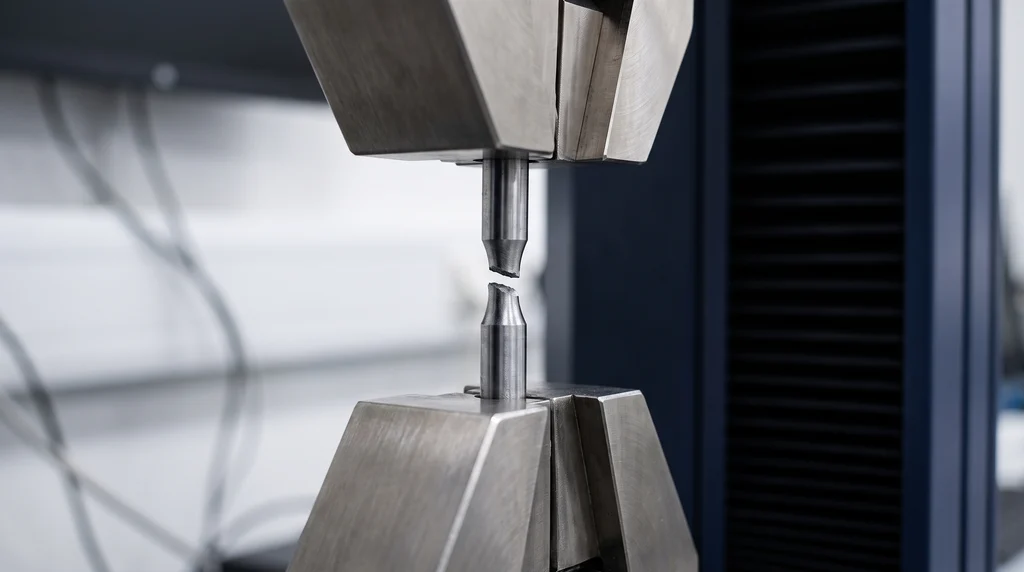
The photo shows a steel test specimen just after fracture, still in the grips: the two tapered ends show the necking that begins when the ultimate tensile strength is reached.
The fact that the area is the original one explains much of the confusion around this topic. During the test the actual cross section shrinks, but the calculation still divides by the starting area. Rm is therefore the maximum force normalized by the starting geometry, not the true stress the material carries at that instant. This makes it possible to compare test specimens of different sizes, which is why test certificates and product standards use Rm.
A common mistake is to say that Rm measures resistance to plastic deformation. That describes yield strength, which comes earlier on the curve: between yielding and Rm the material is already deforming plastically, but it still carries an increasing force.
Symbols and names for ultimate tensile strength
The same quantity appears under different names and symbols depending on the standard, the textbook and the country, and recognizing them avoids mistakes when reading certificates. The table lists the most common ones:
| Symbol | Where it appears | Name used |
|---|---|---|
| Rm | ISO 6892-1 and ABNT NBR ISO 6892-1:2024 | tensile strength |
| fst | ABNT NBR 7480:2024 (Brazilian standard for steel reinforcing bars), rebar | conventional rupture strength |
| fu | ABNT NBR 8800:2008 (Brazilian standard for the design of steel structures) | steel rupture strength |
| σu, σLRT | strength of materials textbooks | ultimate tensile strength |
| Su, UTS | English-language literature, mechanical design | ultimate tensile strength |
| LR, σr | older Brazilian standards, prior to ISO 6892-1 | ultimate strength |
The Brazilian tradition of calling Rm the "rupture limit" or "rupture strength" comes from these older names and is still used in NBR 7480. In textbooks, "rupture limit" is usually a synonym for Rm. Technically, however, the stress at the instant of fracture is a different quantity, as the section on fracture stress shows.
Not to be confused with the fatigue limit
The fatigue limit (endurance limit) is a different concept: the stress amplitude below which the material withstands a very large number of load cycles without failing. It comes from a test with repeated loading, lies well below Rm, and is covered in the article on fatigue testing. Here, "ultimate strength" always means Rm.
Ultimate tensile strength formula and units
The calculation needs only two numbers: the maximum force recorded by the load cell and the original cross-sectional area of the specimen's gauge section, measured before the test. The formulas are:
- Ultimate tensile strength: Rm = Fm / S0, with Fm in newtons and S0 in mm², result in N/mm² = MPa.
- Area of a round test specimen: S0 = π·d0² / 4, where d0 is the original diameter.
- Area of a rectangular test specimen (sheet): S0 = a0·b0, original thickness times width.
For conversions, 1 MPa = 1 N/mm² and 1 ksi = 6.895 MPa. NBR 7480 accepts the approximation 1 MPa ≈ 0.1 kgf/mm², which appears in older rebar catalogs. Force and stress must not be mixed up: Fm is a force, in kN, and depends on the size of the specimen; Rm is a stress, in MPa, a property of the material in the tested condition. Example 1 applies the formula to a test.
Where Rm sits on the stress-strain curve
On the engineering stress-strain curve of a ductile metal, Rm is the highest point of the curve, point C in the figure of the article on the stress-strain curve. What happens before and after that point explains why it is a maximum and not the end of the test.
Between yielding and Rm, the material deforms plastically and uniformly along the whole gauge length. The cross section shrinks, but work hardening, the strengthening caused by the plastic deformation itself, raises the strength faster than the area decreases, and the force keeps rising. At Rm the two effects balance. The strain at this point is the elongation at maximum force, which ISO 6892-1 calls Agt (total) or Ag (plastic part only).
After Rm, the loss of area takes over. Deformation concentrates in a short region that thins out into a neck: this is necking. The force needed to keep elongating the specimen drops until fracture, and the engineering stress drops with it, because it is still divided by S0. The drop is an artifact of the calculation: if the force is divided by the actual area of the neck, the true stress keeps rising until fracture, as explained in the comparison between the engineering and true curves in the stress-strain curve article.
Ductile and brittle materials
The position of Rm relative to fracture depends on how the material behaves. In a ductile metal, such as low-carbon steel, aluminum and copper, the maximum comes before fracture, and fracture occurs at a lower force, after necking. In a brittle material, such as gray cast iron, glass, ceramics and concrete, there is no yielding and no necking: the curve rises until fracture, and Rm practically coincides with the fracture stress. Without plastic deformation, a brittle material fails without warning; ductility and toughness quantify this difference.
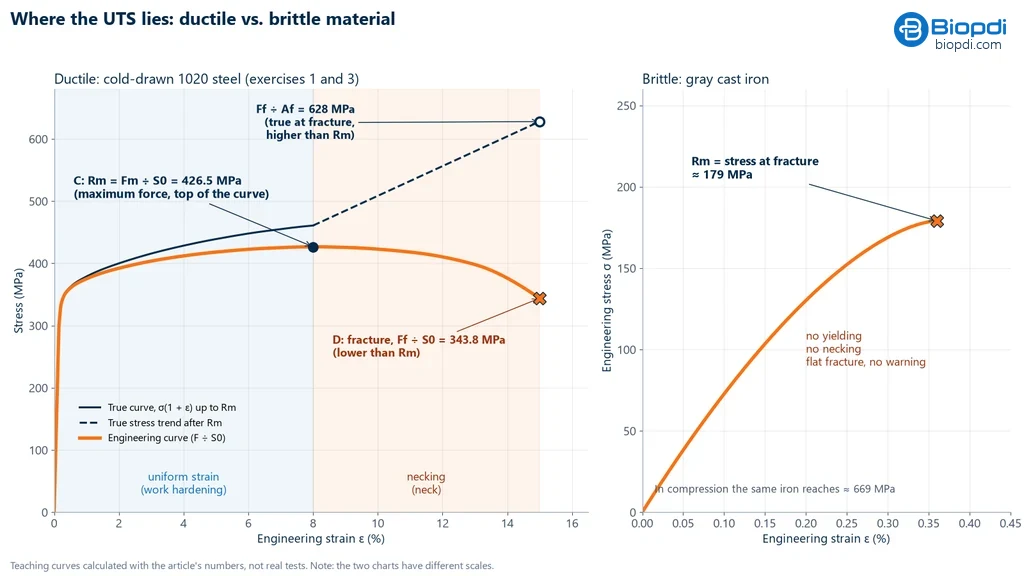
The charts below show both cases. On the left, the cold-drawn 1020 steel from examples 1 and 3: Rm of 426.5 MPa at the top of the engineering curve, fracture at 343.8 MPa, below it, and the true stress at the instant of fracture, about 628 MPa, above it. On the right, gray cast iron fractures right at the peak, at about 179 MPa. The strain scales are different: the cast iron fractures at less than 0.5% strain.
Steel with a yield point plateau: the initial peak is not Rm
Hot-rolled low-carbon steels show, at the start of yielding, a peak followed by a drop in force: the upper yield strength ReH. In some cases this peak is higher than the maximum later reached through work hardening. ISO 6892-1 resolves the ambiguity: for these materials, Fm is the highest force after the onset of work hardening, and the yield peak does not count as the maximum force. The testing software must be configured accordingly, otherwise it reports ReH in place of Rm.
Polymers: three different stresses
In many thermoplastics the curve has a yield peak, drops, forms a stable neck that propagates along the specimen, and only then fractures. The stress at yield may be higher than the stress at break, and "tensile strength" becomes ambiguous. That is why ISO 527-1:2019 and ASTM D638-22 distinguish stress at yield, maximum stress and stress at break, and the report must state which of the three was reported. In polymers, the value also depends strongly on test speed and temperature.
Rm, yield strength and fracture stress
Three quantities read from the same curve are often confused. The first is yield strength, the stress at which plastic deformation begins measurably: ReH and ReL in steels with a yield point plateau and, in other materials, the offset yield strength Rp0.2, the stress that leaves 0.2% permanent strain. It is always below Rm and is the basis for designing ductile parts, which must work without permanent deformation. The definitions, the offset method and the table of steel yield strengths are in the article on elastic limit and yield strength.
The second is Rm itself, the engineering stress at maximum force. The third is fracture stress, the stress at the instant of fracture, which comes in two versions. The engineering fracture stress, σf = Ff / S0, divides the force at fracture by the original area; in a ductile material it is lower than Rm, because the force dropped during necking. The true fracture stress, σv,f = Ff / Su, divides the same force by the minimum cross-sectional area of the neck after fracture, Su; it is higher than Rm, because that area is much smaller than the original one. The same Su gives the reduction of area, Z = (S0 − Su) / S0 × 100. Example 3 calculates both stresses and Z for the same test specimen.
The table summarizes the comparison:
| Quantity | Definition | Symbols | Relative to Rm |
|---|---|---|---|
| Yield strength | onset of measurable plastic deformation | ReH, ReL, Rp0.2, fy | always lower |
| Ultimate tensile strength | Fm / S0, at maximum force | Rm, fst, fu, σu | reference |
| Engineering fracture stress | Ff / S0, at fracture | σf | lower in ductile, equal in brittle materials |
| True fracture stress | Ff / Su, with the final area | σv,f | higher in ductile materials |
Yield-to-tensile ratio and use in design
The Re/Rm ratio measures how much work hardening reserve the material has after yielding, and ABNT NBR 7480:2024 (the Brazilian standard for steel reinforcing bars) controls it for CA-50 rebar by requiring fst/fy ≥ 1.10. This topic, together with allowable stress and the safety factor, is covered in the article on yield strength. Rm enters design directly in two cases. In brittle materials, which do not yield, it becomes the basis for the allowable stress. And in steel structures, ABNT NBR 8800:2008 (the Brazilian standard for the design of steel structures) uses fu in the rupture limit state of the effective net section, the section reduced by bolt holes, with a resistance factor γa2 = 1.35.
Ultimate tensile strength of steel: table by material and condition
The Rm of a steel is not a fixed property of the alloy. It changes with the delivery condition, the heat treatment, the bar size and the heat, so each row of a useful table has to state the material condition and the type of value:
- Typical value: an average published in data sheets. It gives the order of magnitude and varies with the heat and the bar size.
- Specified minimum: the value the product standard guarantees, used in design and in material acceptance.
- Specified range: some standards, such as ASTM A36, set both a minimum and a maximum Rm.
- Characteristic value: a statistical estimate for a lot, used for rebar (fyk).
The first table covers carbon and structural steels, with the yield strength next to the Rm to show the gap between the two. The values are the same as in the table of the article on yield strength:
| Material and condition | Yield strength (MPa) | Rm (MPa) | Type of value and source |
|---|---|---|---|
| AISI 1020 hot rolled (19 to 32 mm bar) | 205 | 380 | typical (ASM table) |
| AISI 1020 cold drawn | 350 | 420 | typical (ASM table) |
| AISI 1045 hot rolled (19 to 32 mm) | 310 | 565 | typical (eFunda) |
| AISI 1045 cold drawn (19 to 32 mm) | 530 | 625 | typical (eFunda) |
| AISI 1045 annealed | 241 | 448 | typical (MetalData, ASTM A519) |
| ASTM A36, plate, shapes and bar up to 200 mm | ≥ 250 | 400 to 550 | specified range (ASTM A36) |
| ASTM A572 Gr 50, shapes and plate up to 100 mm | ≥ 345 | ≥ 450 | specified minimum (ASTM A572) |
| CA-50 (Brazilian rebar grade), hot-rolled ribbed bar | fyk ≥ 500 | fst ≥ 1.10·fy | characteristic and minimum (ABNT NBR 7480:2024, the Brazilian standard for reinforcing steel) |
The second table covers 4140 alloy steel, 304 stainless steel and, for comparison, 6061-T6 aluminum:
| Material and condition | Yield strength (MPa) | Rm (MPa) | Type of value and source |
|---|---|---|---|
| AISI 4140 annealed | ≈ 415 | ≈ 655 | typical (Steelstandart) |
| AISI 4140 normalized | ≈ 655 | ≈ 1,020 | typical (Steelstandart) |
| AISI 4140 quenched and tempered at 650 °C | ≈ 655 | ≈ 862 | typical (AlloyFYI) |
| AISI 4140 quenched and tempered at 540 °C | ≈ 895 to 965 | ≈ 1,035 to 1,070 | typical (sources differ) |
| AISI 4140 quenched and tempered at 425 °C | ≈ 1,100 to 1,170 | ≈ 1,240 to 1,310 | typical (Steelstandart, AlloyFYI) |
| AISI 4140 quenched and tempered at 205 °C | ≈ 1,590 to 1,640 | ≈ 1,770 to 1,790 | typical (Steelstandart, AlloyFYI) |
| 304 stainless, annealed (plate and bar) | Rp0.2 ≥ 205 | ≥ 515 | specified minimum (ASTM A240) |
| 304 stainless, cold-finished bar up to 12.7 mm | ≥ 310 | ≥ 620 | minimum (ASTM A276, condition B) |
| Aluminum 6061-T6 / T651 | 276 | 310 | typical (ASM/MatWeb) |
1020 steel: hot rolled or cold drawn
1020 is the most searched case and shows clearly how much the condition matters. Hot rolled, it has a typical Rm of about 380 MPa; cold drawn, the work hardening from drawing raises the Rm to about 420 MPa and the yield strength to about 350 MPa, while elongation drops to about 15%. The difference between the two yield strengths is much larger than the difference between the two Rm values: cold work uses up part of the work hardening reserve, and the yield-to-tensile ratio rises from about 0.54 to 0.83. Different sources publish slightly different values for the cold-drawn condition, depending on bar size; for material acceptance, the mill certificate or a test of the lot is what counts.
CA-50 rebar: fst ≥ 1.10·fy
Rebar does not have a fixed minimum Rm: ABNT NBR 7480:2024 (the Brazilian standard for steel reinforcing bars) requires a characteristic yield strength fyk ≥ 500 MPa and a tensile strength of at least 1.10 times the measured yield strength, fst ≥ 1.10·fy. Combined, the two requirements give an Rm of at least 1.10 × 500 = 550 MPa for a bar that yields right at the limit. A bar that yields higher needs a proportionally higher Rm: with fy = 560 MPa, the minimum becomes 616 MPa. Many texts still quote 1.08 for this ratio, the value from the 2007 edition, which has been withdrawn.
Which steel has the highest tensile strength
Among commonly used steels, the strongest are alloy steels quenched and tempered at low temperature: 4140 tempered at 205 °C reaches about 1,770 to 1,790 MPa. The same steel annealed stays near 655 MPa, which shows that heat treatment matters more than composition. In the survey by Pavlina and Van Tyne (2008), with 159 data points from a range of steels, Rm ranged from 450 to 2,350 MPa. The high value comes at a cost: quenching followed by low-temperature tempering increases strength and reduces toughness.
What changes Rm
Rm rises with anything that hinders plastic deformation and falls with anything that eases it. The main factors are these:
- Composition: in carbon steels, more carbon gives a higher Rm; hot-rolled 1045 has about 565 MPa against 380 MPa for 1020 in the same condition.
- Heat treatment: quenching and tempering raise Rm, and annealing lowers it. The overview is in heat treatment of metals.
- Cold work: cold rolling and drawing work harden the material, as in cold-drawn 1020.
- Test conditions: the Rm of metals falls with temperature (the values in this article are at room temperature); sheet and composites vary with the test direction; surface finish and speed have little influence on metals and a large one on polymers.
Ultimate tensile strength of other materials
Outside steels, Rm ranges from a few megapascals, in concrete, to hundreds, in aluminum and titanium alloys. As with steels, each value only makes sense together with the material condition. The table gathers reference values:
| Material | Condition | Rm (MPa) | Source |
|---|---|---|---|
| Aluminum 1100 | annealed (O) | ≈ 90 | ASM |
| Aluminum 6061 | T6, aged | ≈ 310 | ASM/MatWeb |
| Aluminum 2014 | T6, aged | ≈ 469 | Strength of Materials, app. C |
| Copper | annealed | ≈ 200 | Callister |
| Brass 70Cu-30Zn | annealed | ≈ 300 | Callister |
| Titanium | annealed | ≈ 520 | Callister |
| Gray cast iron | ASTM class 20, as cast | ≈ 179 (compression ≈ 669) | Strength of Materials, app. C |
| HDPE | room temperature | 22.1 to 31.0 | Callister, Table 15.1 |
| Polypropylene (PP) | room temperature | 31.0 to 41.4 | Callister, Table 15.1 |
| PVC | rigid | 40.7 to 51.7 | Callister, Table 15.1 |
| Nylon 6,6 | room temperature | 75.9 to 94.5 | Callister, Table 15.1 |
| C30 concrete | mean direct tensile strength, fct,m | ≈ 2.9 | ABNT NBR 6118:2023 |
Aluminum shows why "aluminum has 90 MPa" is a half-truth: that value applies to nearly pure annealed aluminum. Aged 6061 alloy reaches about 310 MPa and 2014-T6 about 469 MPa, five times more. In copper and brass, work hardening and alloy composition produce variations of the same order.
Gray cast iron is brittle in tension and about 3.7 times stronger in compression, because in compression the graphite flakes, which act as small cracks, tend to close instead of opening. That is why it is used for bases and bodies loaded in compression, and why the compression test is as important as the tensile test for this material.
Concrete has a tensile strength of about one tenth of its compressive strength. ABNT NBR 6118:2023 (the Brazilian standard for the design of concrete structures) estimates the mean value as fct,m = 0.3·fck2/3 for concretes up to C50; for C30, 0.3 × 302/3 = 2.9 MPa. Direct tension is rarely tested: in practice, tensile strength is measured by splitting (diametral compression, ABNT NBR 7222:2011) or in flexure (ABNT NBR 12142:2010), and the design standard converts the results. The article on the modulus of elasticity of concrete covers the other properties used in design.
Technical ceramics, such as alumina, are also rarely tested in tension, because the grip tends to break the part: strength is measured in the flexural test, with wide scatter, since the result depends on the largest flaw in each test specimen. In fiber composites, Rm is high along the fibers and governed by the matrix at 90° to them, so no value is useful without the orientation.
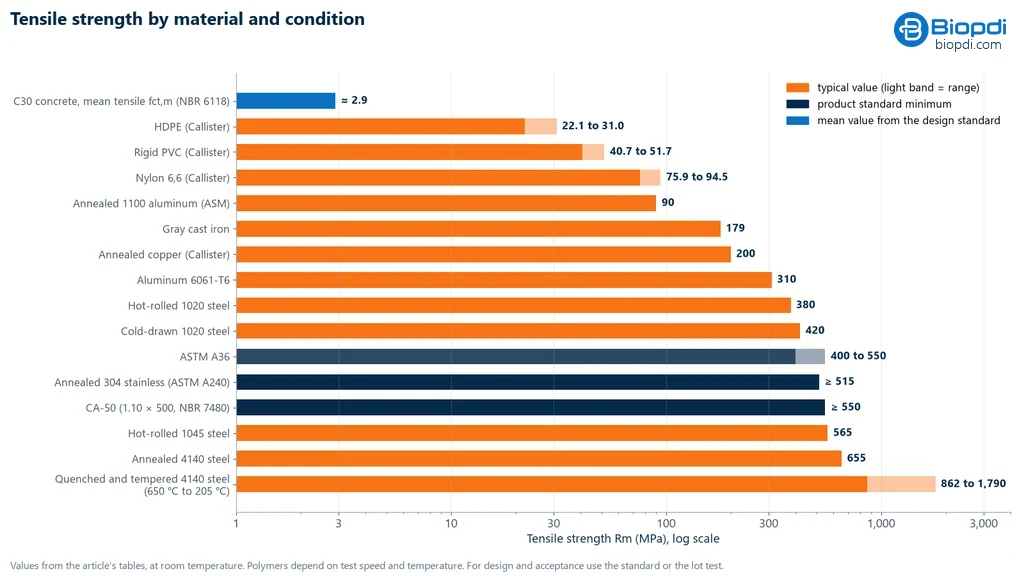
The chart below places the materials from the tables on a single logarithmic scale, with color indicating the type of value: orange for typical, navy blue for standard minimum and blue for the calculated mean value of concrete. The logarithmic scale is needed because the range goes from about 3 MPa to almost 1,800 MPa.
Breaking load: from stress to force
The question "what is the breaking load of steel?" mixes two quantities. Rm is a stress and does not depend on the size of the part; the breaking load is a force and depends on the load-bearing area: F = Rm·S. A 12.5 mm CA-50 bar, with a minimum Rm of 550 MPa, breaks at no less than about 67.5 kN, as calculated in exercise 2. The same calculation, Rm × S0, sizes the testing machine: the capacity must cover the maximum expected force with margin, in a range where the load cell keeps its accuracy class. A 10 mm diameter steel test specimen breaks in the range of 30 to 45 kN; a wire or a polymer film, at tens or hundreds of newtons.
How to measure Rm in the tensile test
Rm is measured in the tensile test of metals per ISO 6892-1:2019 (ABNT NBR ISO 6892-1:2024 in Brazil) or ASTM E8/E8M-25; steel products also follow ASTM A370-26, and plastics, ISO 527-1 or ASTM D638. The procedure that matters for Rm has four steps:
- Measure the initial cross section: diameter, or width and thickness, of the gauge section, with a micrometer or caliper, before the test. A 1% error in diameter becomes about 2% in Rm.
- Mount and test: clamp the test specimen in the grips, aligned, and pull it to fracture at the speed set by the standard. ISO 6892-1 has two control methods: A, based on strain rate, and B, based on stress rate.
- Record the maximum force: the load cell measures the force throughout the test, and the software identifies Fm, disregarding the upper yield point in steels with a yield plateau.
- Calculate: Rm = Fm / S0, reported with the standard, the material condition and the speed used.
What determines the accuracy of Rm is the measurement of force and area. The load cell and the force measuring system must be verified per ISO 7500-1 (ABNT NBR ISO 7500-1:2023 in Brazil) or ASTM E4, and the ISO 6892 series calls for class 1. The extensometer, on the other hand, is not needed for Rm, which depends only on force. It is essential for the modulus of elasticity, Rp0.2 and elongation at maximum force, and it can be removed after Rm, before necking, so it is not damaged at fracture.
Estimating Rm from hardness
In steels, hardness and Rm increase together, and empirical correlations allow one to be estimated from the other without destroying the part. The two most widely used are these:
- Callister and Rethwisch: Rm (MPa) ≈ 3.45 × HB, a rule of thumb for most steels, based on data from the ASM Metals Handbook.
- Pavlina and Van Tyne (2008): Rm = −99.8 + 3.734 × HV, fitted to 159 data points from non-austenitic steels with hardness from 129 to 592 HV and Rm from 450 to 2,350 MPa, with R² of 0.935 and a standard error of 112 MPa.
Both have clear limits. They apply to steel, not to brass or cast iron, which follow other lines. Outside the hardness range used in the fit, the relationship stops being linear. And the standard error of about 110 MPa shows that the estimate is suited to screening and heat treatment control, not to an acceptance report, which requires a tensile test. Conversions between hardness scales follow alloy-specific tables, such as those in ASTM E140. Hardness measurement is covered in the article on hardness testing.
Solved exercises
The five exercises follow the order of the article: calculating Rm from a test, the breaking load of a rebar, the engineering and true fracture stress, an estimate from hardness, and checking the CA-50 ratio.
Exercise 1: Rm of a steel test specimen
Cylindrical specimen of cold-drawn 1020 steel, d0 = 10.00 mm, tested on a 50 kN universal testing machine. The software records a maximum force of 33.5 kN.
- Area: S0 = π × 10.00² / 4 = 78.54 mm².
- Rm = 33,500 / 78.54 = 426.5 MPa.
The result is close to the typical 420 MPa listed in the table for cold-drawn 1020. The extensometer was not needed for this calculation.
Exercise 2: minimum breaking load of a CA-50 rebar
CA-50 bar (the Brazilian reinforcing steel grade with a 500 MPa yield strength), φ = 12.5 mm, yielding right at the limit, fy = 500 MPa.
- Minimum Rm: fst = 1.10 × 500 = 550 MPa.
- Nominal area: π × 12.5² / 4 = 122.7 mm².
- Minimum maximum force: 550 × 122.7 = 67,490 N, about 67.5 kN.
- Bar with φ = 10 mm: 550 × 78.54 = 43,197 N, about 43.2 kN.
The result is a force. To test rebars with a comfortable margin, the machine needs to be in the 100 to 200 kN range.
Exercise 3: engineering and true fracture stress
Same specimen as in exercise 1. The force at fracture was Ff = 27.0 kN, and the smallest neck diameter, measured after fracture, du = 7.4 mm.
- Engineering fracture stress: σf = 27,000 / 78.54 = 343.8 MPa, lower than the Rm of 426.5 MPa.
- Final area: Su = π × 7.4² / 4 = 43.01 mm².
- True fracture stress: σv,f = 27,000 / 43.01 = 627.8 MPa, higher than Rm.
- Reduction of area: Z = (78.54 − 43.01) / 78.54 × 100 = 45%.
The engineering stress at fracture is lower than Rm because the force dropped during necking; the true stress is higher because the actual neck area ended up 45% smaller than the initial area.
Exercise 4: estimating Rm from hardness
A shaft of hot-rolled 1045 steel measures 170 HB.
- By Callister's rule: Rm ≈ 3.45 × 170 = 587 MPa.
- If the measurement were 180 HV, by Pavlina and Van Tyne: Rm = −99.8 + 3.734 × 180 = 572 MPa, with a standard error of 112 MPa.
Both estimates are close to the typical 565 MPa of hot-rolled 1045. They are estimates: they do not replace the tensile test in an acceptance report.
Exercise 5: fst/fy ratio of a CA-50 bar
Test of a CA-50 bar with fy = 540 MPa and fst = 610 MPa.
- fst/fy = 610 / 540 = 1.13, above the minimum of 1.10.
- Minimum Rm for this bar: 1.10 × 540 = 594 MPa, and the measured value was 610 MPa.
The bar meets the strength requirement. Full acceptance under NBR 7480 (the Brazilian standard for steel reinforcing bars) also includes elongation and the bend test.
Ultimate tensile strength standards
The definitions and the method come from the test standards; the minimum values come from the product standards. The table lists those cited in this article:
| Standard | Scope | Edition |
|---|---|---|
| ABNT NBR ISO 6892-1 | tensile testing of metals at room temperature: Fm, Rm, Agt, Z | 2024 |
| ISO 6892-1 | tensile testing of metals at room temperature | 2019 |
| ASTM E8/E8M | tension testing of metals | E8/E8M-25 |
| ASTM A370 | mechanical testing of steel products | A370-26 |
| ABNT NBR ISO 7500-1 | verification of the machine's force-measuring system | 2023 |
| ASTM E4 | force verification of testing machines | not specified |
| ASTM E140 | hardness conversion tables for metals | not specified |
| ASTM D638 | tensile properties of plastics | D638-22 |
| ISO 527-1 | tensile properties of plastics, general principles | 2019 |
| ABNT NBR 7480 | steel for reinforced concrete, Brazil (CA-50: fst ≥ 1.10·fy) | 2024 |
| ABNT NBR 8800 | design of steel structures, Brazil (fu for net section rupture) | 2008 |
| ABNT NBR 6118 | design of concrete structures, Brazil (fct,m) | 2023 |
| ASTM A36/A36M | structural carbon steel | not specified |
| ASTM A240/A240M | stainless steel plate and sheet | not specified |
Machine for measuring ultimate tensile strength
To measure Rm, the universal testing machine must pull the specimen to fracture at a controlled speed, have capacity for the expected maximum force and measure that force with a class 1 load cell. The Biopdi M2 universal testing machine is electromechanical and comes in single-column models, from 200 N to 10 kN, and dual-column models, from 5 kN to 1,000 kN, with class 1 load cells and the BioLab software, which identifies the maximum force, calculates Rm from the entered area and builds the report. The panel below shows the machine, the role of each part in measuring Rm and the grips used.
The universal testing machine in the tensile test
The M2 line has single-column models, from 200 N to 10 kN, and dual-column models, from 5 kN to 1,000 kN. Each part of the machine has a role in measuring ultimate tensile strength:
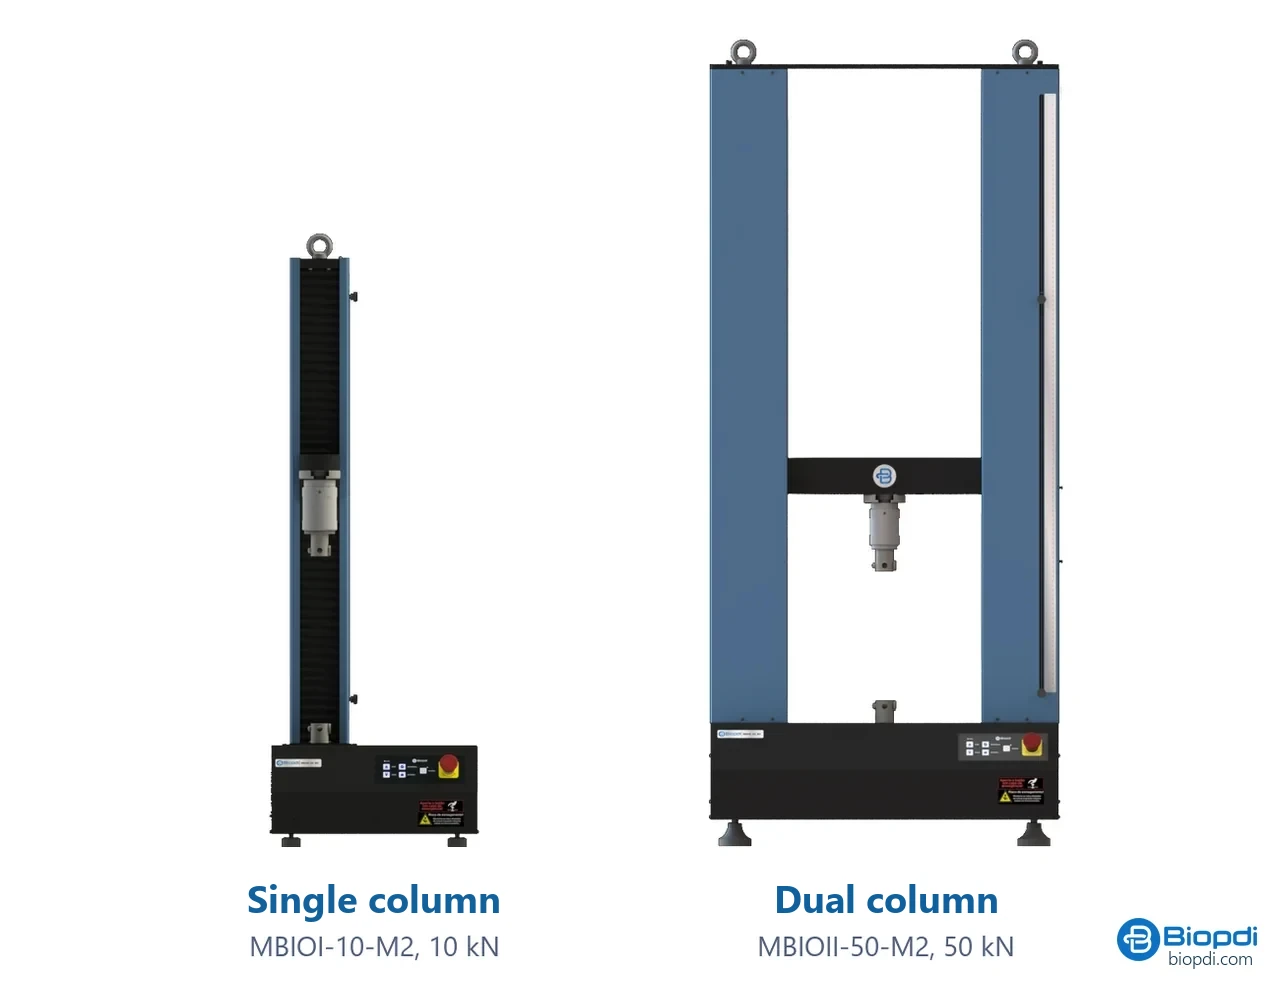
- Moving crosshead pulls the specimen to fracture at the speed set by the standard
- Load cell measures the force, class 1: Fm comes from it
- Grips: wedge, pneumatic, for threaded specimens or for wires
- Extensometer optional for Rm, required for E, Rp0.2 and Agt
- BioLab software identifies Fm, divides it by S0 and builds the report
- Control panel and emergency stop position and stop the test
Fixtures for the tensile test
The fixtures below are mounted on the same machine, depending on the specimen and the standard:
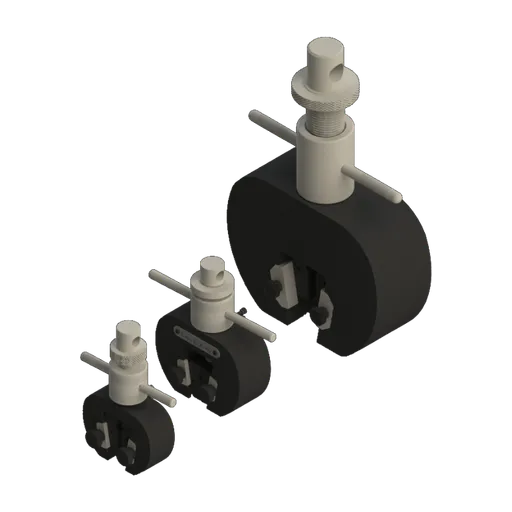 Wedge grip5, 20 and 200 kN
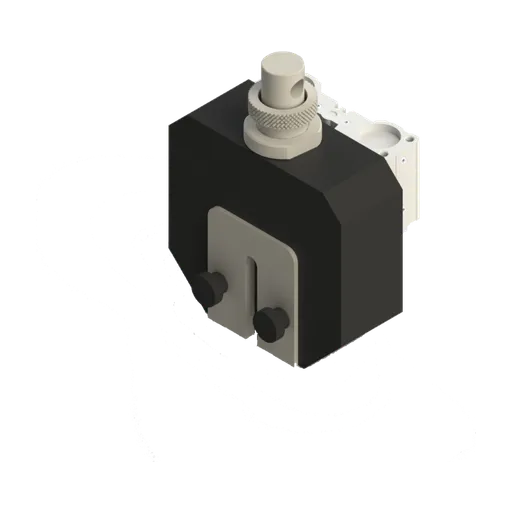 Pneumatic wedge grip50 and 200 kN
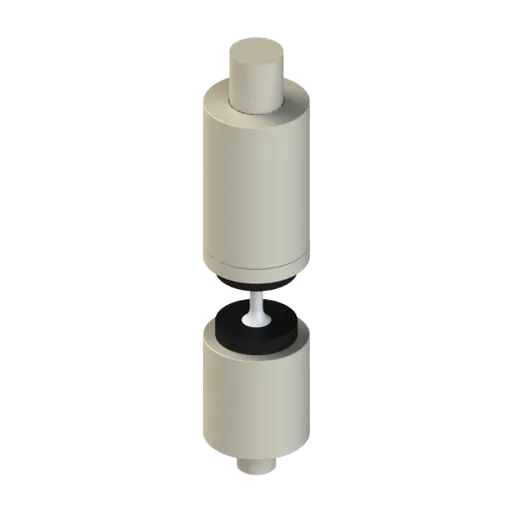 Grip for threaded specimensbolts and threaded specimens
The choice of capacity follows the breaking load calculation. For films, wires and tapes, the 200 N to 1 kN range; for polymers and elastomers, the 2 to 10 kN machine; for machined steel specimens, like the one in exercise 1, and for sheet, the 5 to 50 kN machine (MBIOII-50-M2); for rebars like the one in exercise 2, the 100 to 200 kN machine (MBIOII-200-M2). The BioLab software runs on Windows, connects via USB or serial and does not need an internet connection. The other capacities are on the universal testing machine page.
Other tests and technical references
Elastic limit and yield strength: what they are, the difference, formula, Rp0.2 and steel table
The elastic limit is the highest stress without permanent strain; yield strength is where plastic strain becomes measurable (ReH and ReL, or Rp0.2). See the formula, symbols, 0.2% offset, steel table, CA-50 and exercises.
Mechanical strength: what it is, types, formula and values
Mechanical strength is the maximum stress a material bears before yielding or breaking (MPa). Types, formulas, tests, standards and values by material.
Proportional limit: what it is, how it differs from the elastic limit and yield strength, and how to measure it
In strength of materials, the proportional limit is the highest stress at which stress and strain are still proportional: the end of the straight portion of the curve and of Hooke's law. See the ASTM E6 definition, how it differs from the elastic limit and Rp0.2, how to measure it with an extensometer, and worked examples.
Mechanical properties of materials: what they are, the main types, tests, standards and steel values
The mechanical properties of materials define how a material responds to forces: how much it deforms, whether it returns to its shape, how much load it carries, how much energy it absorbs and how it fractures. See each property with its unit, test and standard, the values for steel (NBR 8800, the Brazilian steel structures design standard; ASTM A36; CA-50, the Brazilian rebar grade), the pairs that are often confused and solved exercises.
Frequently asked questions
What is ultimate tensile strength?
It is the engineering stress corresponding to the maximum force in the tensile test: Rm = Fm/S0 (ISO 6892-1). It sits at the peak of the stress-strain curve and, in ductile metals, marks the onset of necking, not fracture.
What is the symbol for ultimate tensile strength?
Rm in ISO and ABNT standards. Textbooks use σu or σLRT (the Portuguese abbreviation), and in English UTS or Su. In ABNT NBR 7480 (Brazilian standard for rebars) the symbol is fst, and in ABNT NBR 8800 (Brazilian standard for steel structures), fu.
How do you calculate tensile strength?
Divide the maximum force, in newtons, by the initial area of the specimen, in mm². The result is in MPa. Example: 33.5 kN on a 10 mm diameter specimen (78.54 mm²) gives 426.5 MPa.
What is the ultimate tensile strength of 1020 steel?
About 380 MPa hot-rolled and about 420 MPa cold-drawn, as typical values. The value depends on the delivery condition and the size, so check the mill certificate.
What is the tensile strength of steel?
It depends on the grade and condition: ASTM A36 has 400 to 550 MPa, annealed 304 stainless has at least 515 MPa (ASTM A240) and quenched and tempered 4140 exceeds 1,000 MPa, reaching about 1,790 MPa when tempered at 205 °C.
What is the tensile strength of CA-50 steel?
ABNT NBR 7480:2024 requires fyk of at least 500 MPa and fst of at least 1.10 fy. For a bar that yields at 500 MPa, this gives a minimum of 550 MPa. The 2007 edition required 1.08.
What is the breaking load of steel?
It is a force, not a stress: Rm multiplied by the area. A 12.5 mm CA-50 bar breaks at no less than about 67.5 kN, and a 10 mm bar at about 43.2 kN.
Is fracture stress the same as ultimate tensile strength?
Not in a ductile material. The engineering fracture stress, the force at fracture divided by the initial area, is lower than Rm because of necking, and the true fracture stress, divided by the final area, is higher. In a brittle material both practically coincide with Rm.
What is the difference between yield strength and ultimate tensile strength?
Yield marks the onset of measurable plastic deformation; ultimate tensile strength is the stress at maximum force, after work hardening. Yield strength is always lower and is the basis for designing ductile parts.
Which steel has the highest tensile strength?
Among commonly used grades, alloy steels quenched and tempered at low temperature, such as 4140 tempered at 205 °C, with about 1,770 to 1,790 MPa. Pavlina and Van Tyne (2008) recorded steels of up to 2,350 MPa.
Can Rm be determined from hardness?
It can be estimated for steel: Rm ≈ 3.45 × HB (Callister) or Rm = −99.8 + 3.734 × HV (Pavlina and Van Tyne, 2008), with an error of about 110 MPa. For a test report, the tensile test is performed.
Is an extensometer needed to measure Rm?
No. Rm depends only on the maximum force and the initial area, so a verified load cell and a correct measurement of the cross-section are enough. The extensometer is essential for the modulus of elasticity, Rp0.2 and the elongation at maximum force.