
Quality engineering is the branch of engineering that uses statistics, metrology and testing to design, measure, control and improve processes, so that products conform to specifications and standards, with known variation and decisions based on reliable measurements.
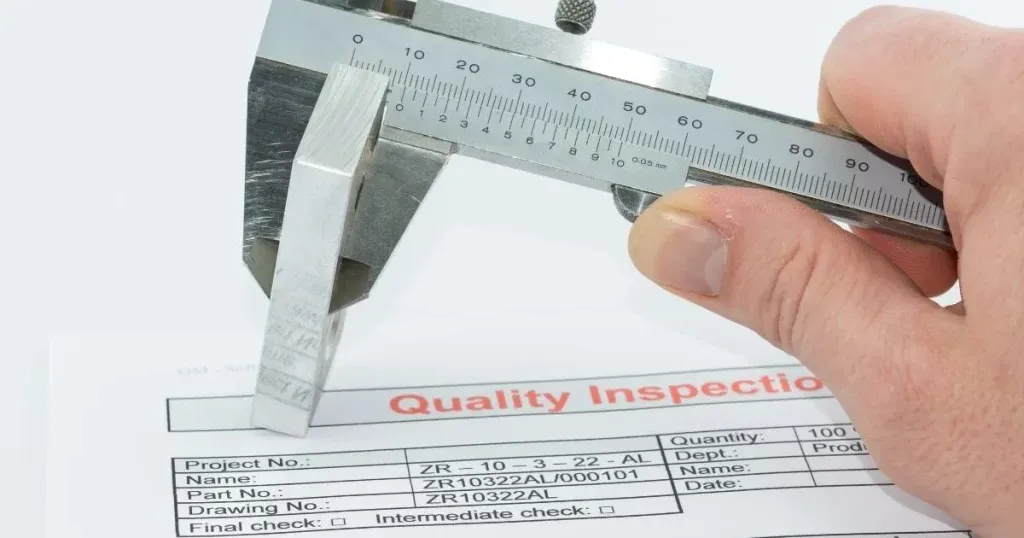
In practice, everything comes down to measuring variation and deciding with data, as in the process capability index Cpk = min[(USL − μ)/3σ, (μ − LSL)/3σ], which tells whether a stable process fits within the customer's tolerance. This article presents the tools with worked examples, the standards in force on September 30, 2026 (ISO 9001:2026 was published on September 16, 2026), calibration of testing machines, incoming inspection and careers. The photo shows a caliper measuring a part on an inspection sheet: the most common scene in the field, which only has value if the instrument is reliable and the data feeds a decision.
What is quality engineering
Quality engineering treats quality as a process variable, not as sorting at the end of the line. Montgomery (Introduction to Statistical Quality Control, 8th ed., 2019) defines quality improvement as the reduction of variability in processes and products. Every part varies slightly from the next; the question for the field is how much, why, and whether that variation fits within what the customer specified.
The statistical foundation comes from Walter A. Shewhart, at Bell Telephone Laboratories: he proposed the control chart in 1924 (Best and Neuhauser, 2006) and published Economic Control of Quality of Manufactured Product in 1931. His central contribution was to separate two types of variation:
- Common cause: the natural variation of the process, the sum of small sources that are always present (clearances, material differences, temperature). It can only be reduced by changing the process.
- Special cause (or assignable cause): an identifiable event, such as a broken tool, a different raw material lot or a setup error. It must be found and eliminated.
Then came the names behind the tools in this article: W. Edwards Deming popularized the PDCA cycle; Joseph Juran showed that a few types of defect account for most of the losses, the Pareto principle; Kaoru Ishikawa created the cause-and-effect diagram. The automotive industry gathered these methods into reference manuals known as the core tools, still required of suppliers today.
Quality engineering is not a synonym for industrial engineering: it is a specialty followed by industrial, mechanical, materials and chemical engineers. Industrial engineering deals with the production system as a whole (capacity, costs, logistics); quality engineering measures and controls whether what comes out of it conforms.
Quality tools
The tools answer different questions and follow a logical order: find out whether the process is stable, trust the measurement, and only then measure capability; in parallel, anticipate failures and investigate causes. The sections follow this order, and the table at the end summarizes each one.
SPC and control charts
Statistical Process Control (SPC) tracks a measured characteristic throughout production to separate common cause from special cause. At each interval, a subgroup of parts is taken (for example, 5 consecutive parts), and the subgroup mean, X̄, is plotted on one chart and the range R (largest minus smallest value) on another: the X̄ chart monitors the location of the process; the R chart, its spread.
The limits come from the process itself, at ±3 standard deviations of the sample mean. With X̿ the grand mean, R̄ the average range and the constants for n = 5 (A2 = 0.577; D3 = 0; D4 = 2.114; d2 = 2.326, according to Montgomery):
- X̄ chart: UCL = X̿ + A2R̄ and LCL = X̿ − A2R̄;
- R chart: UCL = D4R̄ and LCL = D3R̄;
- estimated process standard deviation: σ̂ = R̄ / d2.
Worked example. A 10.00 mm diameter is measured in 25 subgroups of 5 parts, with X̿ = 10.010 mm and R̄ = 0.023 mm.
- X̄ chart: UCL = 10.010 + 0.577 × 0.023 = 10.0233 mm; LCL = 10.010 − 0.0133 = 9.9967 mm.
- R chart: UCL = 2.114 × 0.023 = 0.0486 mm; LCL = 0.
- σ̂ = 0.023 / 2.326 = 0.0099 mm, about 0.010 mm, the value used later for capability.
The points fluctuate around the center line with no pattern, which is common cause, until subgroup 19, which goes above the upper limit and signals a special cause to be investigated before production continues; long runs on one side of the line and trends are also signals. The chart below shows this X̄ chart with illustrative data that reproduce the numbers in the example.
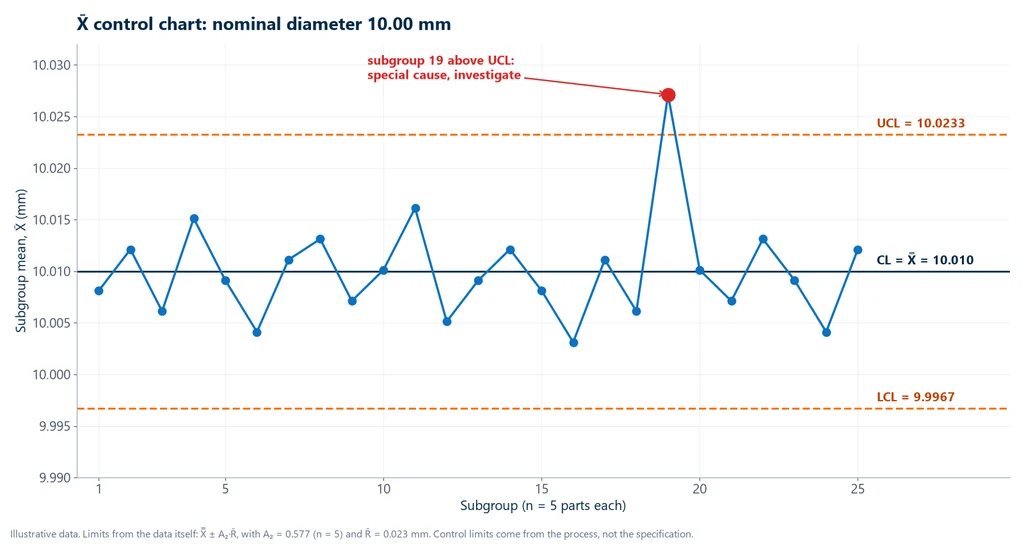
The most common mistake is confusing control limits with specification limits. The former come from the process and tell whether it is stable; the latter come from the design or the customer and tell whether the part is acceptable. A process can be in control and still produce parts out of specification. Comparing the two is the role of the capability indices, but first the measurement must be trustworthy.
MSA and Gage R&R: can you trust the measurement?
Every value on the chart includes the error of the measurement system: instrument, operator, method and environment. Measurement Systems Analysis (MSA) quantifies this error. The most widely used study is the repeatability and reproducibility study (Gage R&R): several parts measured more than once by more than one operator. Repeatability is the variation of the same operator on the same part; reproducibility, the difference between operators.
With σtotal² = σGRR² + σpart², the AIAG manual (Measurement Systems Analysis, 4th ed., 2010) evaluates two numbers:
- %GRR = 100 × σGRR / σtotal: below 10%, acceptable; from 10% to 30%, conditionally acceptable, depending on application, cost and customer approval; 30% or more, unacceptable;
- number of distinct categories, ndc = 1.41 × σpart / σGRR, truncated: it must be at least 5.
Worked example. σGRR = 0.004 mm and σpart = 0.015 mm. Then σtotal = √(0.004² + 0.015²) = 0.0155 mm; %GRR = 0.004 / 0.0155 = 25.8%, conditional; ndc = 1.41 × 0.015 / 0.004 = 5.3, which becomes 5. The decision is to accept with justification or improve the instrument before running SPC. In destructive testing, such as the tensile test, classic R&R does not apply, because the test specimen cannot be tested twice; there, calibration of the machine, covered later, matters even more.
Process capability: Cp and Cpk
With a stable process and a reliable measurement, the capability indices compare natural variation with the tolerance. With USL and LSL the upper and lower specification limits, μ the mean and σ the standard deviation:
- Cp = (USL − LSL) / 6σ: potential capability; compares the width of the tolerance with the ±3σ spread, without looking at the mean.
- Cpk = min[(USL − μ)/3σ, (μ − LSL)/3σ]: actual capability; the distance from the mean to the nearest limit. It is always less than or equal to Cp, and equal when the process is centered.
Worked example. The diameter from the chart has a specification of 10.00 ± 0.05 mm (LSL = 9.95; USL = 10.05), μ = 10.01 mm and σ = 0.010 mm.
- Cp = (10.05 − 9.95) / (6 × 0.010) = 0.10 / 0.060 = 1.67.
- Upper side: (10.05 − 10.01) / 0.03 = 1.33; lower side: (10.01 − 9.95) / 0.03 = 2.00.
- Cpk = the smaller = 1.33.
The mean, shifted 0.01 mm upward, sits 4σ from the upper limit and 6σ from the lower one; centered at 10.00 mm, the same process would have a Cpk of 1.67, equal to Cp. There is spread to spare, and the fix is a centering adjustment, not a new machine. The chart below compares the actual process, in blue, with the same process centered, dotted.
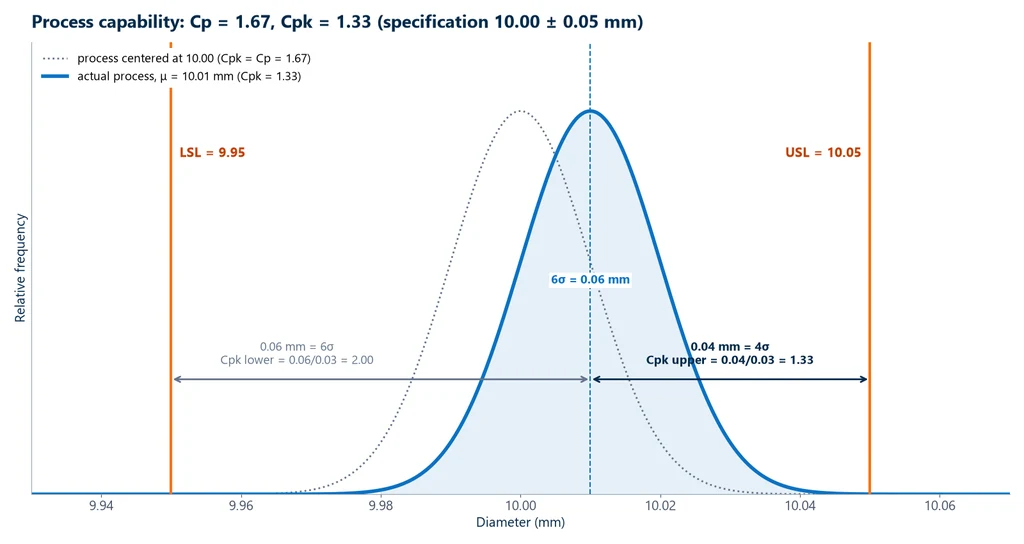
There is no universally acceptable Cpk: the requirement comes from the customer or the contract, and the most common reference is Cpk ≥ 1.33, with higher requirements for critical characteristics. The indices assume a process in control and an approximately normal distribution, and they use the short-term σ (R̄/d2); Pp and Ppk use the overall standard deviation and measure long-term performance.
FMEA: anticipating failure before production
The previous tools look at the process that exists; FMEA (Failure Mode and Effects Analysis) looks ahead. A team from design, process, quality and maintenance lists what can fail, the effect on the customer and the cause, and prioritizes actions before the failure happens. DFMEA analyzes the product design; PFMEA, the process.
Each failure mode receives ratings from 1 to 10 for severity (S), occurrence (O) and detection (D). Prioritization used to be done by the RPN, the product S × O × D. The 2019 AIAG and VDA manual (FMEA Handbook), organized in 7 steps, replaced the RPN with action priority (AP: high, medium or low), read from a table that gives more weight to severity. The reason: S = 10, O = 2 and D = 5 give an RPN of 100, the same as S = 2, O = 5 and D = 10, and the two failures do not deserve the same attention. The action that reduces occurrence or improves detection is often a test, such as design validation through fatigue testing.
Root cause analysis: Ishikawa, 5 whys and Pareto
When the chart shows a special cause or a nonconformity appears, three simple tools structure the investigation:
- Ishikawa diagram (fishbone): the problem at the "head" and the possible causes in six categories, the 6Ms: method, machine, manpower, material, measurement and mother nature (environment). The measurement "M" connects to MSA and calibration; the material "M", to testing and metallography.
- 5 whys: ask "why?" repeatedly until you reach a cause you can act on. It works for simple causal chains; with several combined causes, it needs the Ishikawa diagram and data.
- Pareto chart: bars with the defect types in decreasing order of frequency or cost, plus the cumulative curve, to tackle the "vital few" first, in Juran's phrase. The 80/20 rule is a heuristic, not a law.
PDCA: the cycle that organizes improvement
PDCA ties the tools together in a cycle: plan (Plan: understand the problem with data, find the cause, define the action), do (Do), check (Check: measure whether it worked, for example on the control chart) and act (Act: standardize or start over). The introduction to ISO 9001:2015 describes the management system with this same cycle.
Summary: which tool to use
The table below summarizes the tools by the question each one answers and when to use it; sampling inspection, covered later, completes the list.
| Tool | Question it answers | When to use | Typical output |
|---|---|---|---|
| SPC and control charts | Is the process stable? | series production, measured characteristic | X̄-R, X̄-S, p, u charts |
| MSA / Gage R&R | Can you trust the measurement? | before SPC and capability; for every new measurement system | %GRR and ndc |
| Cp / Cpk | Does the stable process meet the tolerance? | after SPC shows stability | index (e.g., Cpk 1.33) |
| FMEA (DFMEA, PFMEA) | What can fail, and with what priority? | design and process planning | failure modes with AP |
| Ishikawa | What are the possible causes? | team problem analysis | 6M diagram |
| 5 whys | What is the root cause? | simple causal chain | root cause and corrective action |
| Pareto | Which problem to tackle first? | many defect types | defect ranking |
| PDCA | How to organize improvement? | any improvement cycle | verified and standardized action |
| Sampling inspection | Do I accept or reject the lot? | incoming and final lot inspection | acceptance decision |
Quality standards in 2026
Quality tools tell you how to measure and decide. Standards tell you what an organization or a laboratory has to demonstrate before third parties will trust it. ISO management system standards, represented in the photo below, are the common vocabulary of company, customer and auditor. The editions cited were checked on September 30, 2026.

ISO 9001:2026 and ISO 9000:2026
ISO 9001 sets out the certifiable requirements for a quality management system, for organizations of any type and size. The sixth edition, ISO 9001:2026, was published on September 16, 2026 and replaces the 2015 edition, whose certificates remain valid until September 30, 2029. According to ISO and the certification body DNV, the main changes are quality culture and ethical behavior as leadership responsibilities (5.1.1), the separation of risks and opportunities (6.1.1 to 6.1.3), stronger change management requirements and more attention to knowledge management. In Brazil, the Portuguese version is still ABNT NBR ISO 9001:2015. As of this revision we have not found an ABNT NBR ISO 9001:2026.
ISO 9000, also revised in 2026, gives the vocabulary and the seven quality management principles: customer focus, leadership, engagement of people, process approach, improvement, evidence-based decision making and relationship management. This is what the standards say when people ask about the "pillars" of quality. Lists of four pillars circulate in training courses, but no official list exists.
IATF 16949: the automotive requirement
IATF 16949 supplements ISO 9001 for the automotive supply chain and requires the core tools: APQP (advanced product quality planning), PPAP (production part approval process), FMEA, MSA and SPC. The current edition is from 2016. IATF communication SC-2026-005 (July 2026) confirmed that a second edition is in development, with publication expected in 2027.
ISO/IEC 17025: laboratory competence
ABNT NBR ISO/IEC 17025:2017 (the Brazilian adoption of ISO/IEC 17025) sets the competence requirements for testing and calibration laboratories: a validated method, qualified personnel, equipment calibrated with traceability, measurement uncertainty and the report. The 2017 ISO edition was confirmed in the 2023 systematic review. In Brazil, accreditation is granted by Cgcre, the accreditation body of Inmetro (Brazil's national metrology institute). Accredited calibration laboratories make up the RBC (Brazilian Calibration Network) and accredited testing laboratories make up the RBLE (Brazilian Network of Testing Laboratories).
The difference between the two standards is the difference between certification and accreditation. ISO 9001 certifies that the organization has a management system. ISO/IEC 17025 accredits a laboratory as competent to produce a specific result. A certified company may have an in-house laboratory that is not accredited, and a certificate is RBC only if it comes from a laboratory accredited for that service.
ISO 10012:2026: measurement management
ISO 10012 covers the measurement management system: metrological confirmation, calibration interval, uncertainty and decision rule. The second edition, from February 2026, replaced the 2003 edition and adopted the common structure of ISO management standards. It details what ISO 9001 asks for in the monitoring and measuring resources requirement (7.1.5 in the 2015 edition).
ISO 14001 (environmental management) and ISO 45001 (occupational health and safety) show up in lists of "quality standards", but they do not deal with product quality. They come in when a company runs an integrated management system that is audited together with ISO 9001.
Metrology and calibration of testing machines
When the controlled characteristic is a mechanical property, such as the tensile strength of a bar, the measuring instrument is the testing machine, and it enters the measurement management system like any caliper. Three terms need to be kept apart. Calibration compares the indication with a traceable standard and states error and uncertainty. Verification confirms that the instrument meets a class. Adjustment is the intervention that reduces the error, and it is followed by a new calibration.
ISO 7500-1: machine force
ISO 7500-1:2018, adopted in Brazil as ABNT NBR ISO 7500-1:2023, covers the calibration and verification of the force-measuring system of tension and compression testing machines: general inspection, calibration with reference instruments at several points across the range, and assignment of a class. In class 1, the relative accuracy error q does not exceed ±1.0% and the repeatability b does not exceed 1.0%. In class 0.5, both drop to 0.5%. The standard also limits reversibility, zero error and resolution, and it does not set an interval. Twelve months is common practice, shortened after maintenance, relocation or heavy use.
Worked example. With the reference standard at 10.00 kN, the machine reads 10.04, 10.06 and 10.05 kN in three series. The mean is 10.05 kN, q = (10.05 − 10.00) / 10.00 × 100 = +0.5% and b = (10.06 − 10.04) / 10.00 × 100 = 0.2%. At this point the machine meets class 1 comfortably and is at the limit of class 0.5. The final class depends on every point in the range.
ISO 9513: the extensometer
The extensometer measures elongation on the test specimen, and it is what makes the modulus of elasticity and the offset yield strength accurate. Its calibration follows ISO 9513:2012 (ABNT NBR ISO 9513:2013 in Brazil), which places it in classes 0.2, 0.5, 1 and 2. Test standards specify the minimum class for each result. The American equivalents are ASTM E4 for force and ASTM E83 for extensometers.
Force error inside Cpk
Calibration feeds straight into capability indices. Take a batch of bars with a hypothetical minimum tensile strength of 500 MPa (an illustrative value, not tied to any product standard). Across 30 test specimens, the mean is 560 MPa and the standard deviation is 15 MPa. With only one limit, the one-sided Cpk applies:
- Cpk = (560 − 500) / (3 × 15) = 60 / 45 = 1.33.
- If the machine reads 1% high, which is the class 1 limit, the true values are the readings divided by 1.01: a mean of 554.5 MPa and a standard deviation of 14.9 MPa.
- True Cpk = 54.5 / (3 × 14.9) = 1.22, below the 1.33 benchmark.
A machine within its class can make a batch look capable when it is not. That is why the calibration certificate with its uncertainty belongs in the quality file. The article on the universal testing machine explains how the load cell and the extensometer measure force and strain.
Materials testing in quality control
The testing laboratory turns requirements into evidence. A minimum strength specification only holds up if a standardized test, run on calibrated equipment, verifies it. The article on materials testing gives the full overview (mechanical, non-destructive, metallographic, chemical and physical tests). This section is about where those tests fit into the quality system.
Incoming inspection and sampling
When a lot arrives, the company decides from a sample whether to accept or reject it. For inspection by attributes (conforming or nonconforming part), the Brazilian reference is ABNT NBR 5426:1985 (the Brazilian standard for attribute sampling plans), still in force, with ABNT NBR 5427 as its usage guide. It defines the unit of product, the classification of defects and the acceptable quality level (AQL), and it provides single, double and multiple sampling plans. The sample size and the number of defectives that accept or reject the lot come from the tables, based on the lot size and the AQL agreed with the supplier.
For sheet, bar, wire, polymers and fasteners, incoming inspection usually includes tests on samples from the lot, compared against the supplier's certificate: tensile, compression or bend tests, among the main mechanical tests. The tensile test is the most common because a single test gives the yield strength, the ultimate tensile strength and the elongation that product standards specify. The results also go into control charts, for example yield strength per heat on an X̄-S chart, and the capability study is part of supplier approval in PPAP. Heat-treated parts are controlled by hardness, and the procedure is in the article on the hardness test.
Failure analysis
When a part fails, the "material" branch of the Ishikawa diagram is answered in the laboratory: the fracture surface and the microstructure reveal inclusions, incorrect heat treatment or out-of-spec material. Specimen preparation goes through cutting, mounting, grinding and polishing, using the metallographic cutting machine and the metallographic grinding and polishing machine, and the analysis is done on the metallurgical microscope.
The universal testing machine in the quality lab
Tensile, compression, flexural and bend tests all fit on a single universal testing machine by changing grips and fixtures. Biopdi's M2 line has models from 200 N to 1,000 kN, measures force with a load cell and accepts an extensometer. The BioLab software calculates the results, generates the report for each test specimen and logs the usage history by user level. For the traceability required by ISO 9001 and ISO/IEC 17025, the machine must be calibrated to ISO 7500-1 (ABNT NBR ISO 7500-1 in Brazil) by an accredited laboratory. For configurations and lead times, see the request a quote page.
What a quality engineer does
The quality engineer plans how the process will be controlled and responds when it goes out of control. In the photo, a professional records a process check on the line: much of the work happens on the shop floor.

Typical activities are:
- Control plan: which characteristics to measure, with which instrument, how often and what the reaction plan is.
- Statistical control: control charts and capability studies.
- Measurement: calibration of instruments and testing machines, and MSA studies.
- Prevention: design and process FMEAs with the engineering teams.
- Nonconformities: root cause, corrective action and verification of effectiveness.
- Management system and suppliers: ISO 9001 documentation and audits (plus IATF 16949 in the automotive sector), supplier qualification and incoming inspection.
Education
In Brazil, the usual path is an engineering degree of about five years followed by a specialization. Industrial, mechanical, materials and chemical engineering are the most common backgrounds, and the articles on mechanical engineering and materials engineering describe those programs. Postgraduate courses in the field are short. The Brazilian university Uninter's course in Quality and Productivity Engineering (Engenharia da Qualidade e Produtividade) runs 6 months and 360 hours online, covering statistical quality control, ISO 9000 systems and auditing, Six Sigma and Lean, and product engineering with QFD, FMEA and DOE (course page, accessed September 30, 2026).
Salary and legal minimum wage in Brazil
According to Glassdoor, the average pay for a quality engineer in Brazil is R$ 8,833 per month in Brazilian reais (R$ 8,000 base and R$ 833 variable), with half of the values between R$ 6,942 and R$ 11,500, based on 250 salaries reported up to May 2026. This is self-reported data and varies by region, company size and sector.
The legal minimum is a different number. Brazilian Law 4.950-A/1966 sets the engineer's minimum at 6 minimum wages for a 6-hour working day, with additional hours paid at a 25% premium, which gives 8.5 minimum wages for 8 hours under the text of the law. CREA-PA (the Pará state engineering council) and SEESP (the São Paulo state engineers' union) calculate 9, applying the 50% overtime premium set by the 1988 Brazilian Constitution. In 2022 (ADPF 171), Brazil's Supreme Federal Court (STF) upheld the law but prohibited automatic adjustment by the minimum wage, and the professional bodies apply the ruling in different ways:
- CREA-PA (June 2023) uses the frozen base of R$ 1,212, the minimum wage on the date of the ruling: R$ 7,272 for 6 hours and R$ 10,908 for 8 hours;
- SEESP (January 2026) applies the minimum wage in force at hiring, R$ 1,621 since January 1, 2026: 6 × R$ 1,621 = R$ 9,726 for 6 hours (the union publishes R$ 9,729) and 9 × R$ 1,621 = R$ 14,589 for 8 hours.
The Glassdoor average is below the 8-hour minimum under both calculations, which shows that some positions do not follow it, either because of a shorter working day or because the job is not registered as an engineering position. For a specific hire, the regional collective bargaining agreement applies.
Standards cited
The table lists the standards and manuals cited in this article, with the current edition checked on September 30, 2026:
| Standard | Scope | Edition |
|---|---|---|
| ISO 9001 | quality management systems: requirements | 2026 (2015 certificates valid until September 30, 2029) |
| ABNT NBR ISO 9001 | Brazilian version of ISO 9001 | 2015 |
| ISO 9000 | fundamentals, vocabulary and the seven quality management principles | 2026 |
| IATF 16949 | automotive quality management system | 2016 (2nd edition expected in 2027) |
| ISO/IEC 17025 | competence of testing and calibration laboratories | 2017 (ABNT NBR ISO/IEC 17025:2017) |
| ISO 10012 | measurement management systems | 2026 (replaced the 2003 edition) |
| ISO 7500-1 | calibration and verification of the force of tension and compression testing machines | 2018 (ABNT NBR ISO 7500-1:2023) |
| ISO 9513 | calibration of extensometers | 2012 (ABNT NBR ISO 9513:2013) |
| ASTM E4 | force verification of testing machines | current |
| ASTM E83 | verification and classification of extensometers | E83-25 |
| ABNT NBR 5426 | sampling plans for inspection by attributes (Brazil) | 1985 |
| ABNT NBR 5427 | usage guide for NBR 5426 | 1985 |
| AIAG and VDA, FMEA Handbook | design and process FMEA, action priority | 2019 |
| AIAG, Measurement Systems Analysis | measurement systems analysis, %GRR and ndc criteria | 4th ed., 2010 |
Other tests and technical references
Industrial engineering: what it is, the 10 ABEPRO areas, professional duties, salary in Brazil and tools
Industrial engineering (engenharia de produção in Brazil) is the engineering that designs, implements, operates and improves integrated production systems for goods and services, according to ABEPRO (the Brazilian Association of Production Engineering). See the 10 areas and 58 subareas defined by ABEPRO, the professional duties set by Confea Resolution 235/1975 (Brazil's Federal Council of Engineering), the course curriculum, the salary in Brazil according to Novo CAGED (the Brazilian formal employment registry) and the minimum wage under Brazilian Law 4.950-A, and the Lean, Six Sigma, PPC, MRP and OEE tools with worked examples.
Civil engineering: what it is, what civil engineers do, fields, salary and materials testing
Civil engineering is the branch of engineering that plans, designs, builds and maintains buildings and infrastructure, such as roads, bridges, dams, ports and sanitation. In Brazil, the duties of a civil engineer are set out in Article 7 of CONFEA Resolution 218/1973 (CONFEA is Brazil's Federal Council of Engineering and Agronomy), and practicing the profession requires registration with a CREA (Brazil's Regional Council of Engineering and Agronomy). See the fields, the degree program, salaries in Brazil with a dated source, the minimum wage for engineers under Brazilian Law 4,950-A/66, and the tests on concrete, steel, mortar and soils.
Mechanical engineering: what it is, what mechanical engineers do, curriculum, professional duties and salary in Brazil
Mechanical engineering is the branch of engineering that designs, manufactures, tests and maintains machines, equipment, vehicles and thermal systems. In Brazil, the professional duties of a mechanical engineer are set out in Article 12 of CONFEA Resolution 218/1973 (CONFEA is Brazil's Federal Council of Engineering and Agronomy). The degree requires at least 3,600 hours over 5 years, and the legal minimum salary for a 6-hour workday is R$ 7,272.00 (Brazilian reais). See the fields of work, the curriculum, the role of mechanical testing in training and in industry, and salary data with a dated source.
Triaxial test: what it is, UU, CU and CD types, calculations and standards
What the triaxial test is, what the name means, the UU, CU and CD types with their standards, the B parameter, the formulas and worked CU, UU and CD examples.
Frequently asked questions
What is quality engineering?
It is the field that uses statistics, metrology and testing to design, measure, control and improve processes so that products conform to specifications and standards. Its core tools are SPC, the Cp and Cpk indices, MSA, FMEA and root cause analysis.
What does a quality engineer do?
A quality engineer builds the control plan, sets up control charts and capability studies, manages calibration and MSA, leads FMEAs, investigates nonconformities down to the root cause and maintains the ISO 9001 management system. In the automotive industry, the job also covers the IATF 16949 core tools and supplier qualification.
What is the minimum salary for a quality engineer in Brazil?
Under Brazilian Law 4.950-A/1966, the minimum is 6 minimum wages for a 6-hour day, with each additional hour paid at a 25% premium, which gives 8.5 minimum wages for an 8-hour day (CREA-PA, the regional engineering council of Pará, and SEESP, the São Paulo engineers' union, calculate 9, with overtime at 50%). With the 2026 minimum wage, SEESP publishes R$ 9,729 (Brazilian reais) for 6 hours and R$ 14,589 for 8 hours; CREA-PA uses the frozen base of R$ 1,212 from the 2022 decision of the STF (Brazil's Supreme Federal Court). The market average on Glassdoor in Brazil is R$ 8,833 per month (May 2026).
How many years does a quality engineering program take?
In Brazil, training is usually a specialization after an engineering degree, which takes about five years. Graduate programs in the field are short: the one at Uninter (a Brazilian university), for example, takes 6 months and 360 hours.
What are the 4 pillars of quality management?
There is no official list of four pillars. The normative reference is the seven quality management principles of ISO 9000: customer focus, leadership, engagement of people, process approach, improvement, evidence-based decision making and relationship management.
Did ISO 9001 change in 2026?
Yes. ISO 9001:2026 was published on September 16, 2026, and certificates to the 2015 version remain valid until September 30, 2029. The changes strengthen quality culture, the separation between risks and opportunities, and change management. The Brazilian ABNT version is still the 2015 edition.
What is the difference between Cp and Cpk?
Cp compares the width of the tolerance with the 6σ spread of the process and does not consider where the mean lies. Cpk measures the distance from the mean to the nearest limit in units of 3σ. A process with a Cp of 1.67 and a Cpk of 1.33 has acceptable spread but is off-center.
What is MSA and when is a measurement system accepted?
MSA is measurement system analysis. According to the AIAG manual (4th ed., 2010), a %GRR below 10% is acceptable, 10% to 30% is conditionally acceptable and 30% or more is unacceptable; the number of distinct categories must be at least 5.
What is the difference between ISO 9001 and ISO/IEC 17025?
ISO 9001 certifies an organization's management system. ISO/IEC 17025 accredits a laboratory's technical competence for specific tests or calibrations, which in Brazil is done by Cgcre, the accreditation body of Inmetro (Brazil's national metrology institute).
How often should a universal testing machine be calibrated?
ISO 7500-1 recommends verification at intervals of no more than 12 months, unless otherwise specified, and sooner after a major repair or adjustment, relocation or heavy use, by a laboratory with traceability, preferably accredited in the RBC (the Brazilian Calibration Network).
What is NBR 5426?
It is the ABNT standard (Brazilian standard) from 1985, still in force, that provides sampling plans for inspection by attributes: single, double and multiple sampling plans, based on lot size and acceptable quality level (AQL). It is used to accept or reject lots at receiving inspection; NBR 5427 is its user guide.