
In engineering, soil compaction is the rapid reduction of air voids by mechanical energy, carried out in layers in embankments, subgrades and dams. The Proctor test, governed in Brazil by ABNT NBR 7182:2025 (the Brazilian standard for soil compaction testing), compacts the soil at five moisture contents and gives the optimum moisture content and the maximum dry density, which become the target for field control. In the small 1,000 cm³ mold, standard effort is applied by a 2,500 g rammer dropping from 305 mm, 26 blows on each of 3 layers. In the field, the degree of compaction (relative compaction) compares the dry density measured in the layer with the laboratory value.
In agronomy, the same term means something else: the unwanted densification of cropland by machinery and trampling, which harms roots and water infiltration. This guide covers compaction as a construction operation. The difference between the two is summarized in the section soil compaction on the construction site and in the crop field. Below are the concept, the standards (with the current edition checked on October 7, 2026), the apparatus, the three compaction efforts, the step-by-step procedure, the calculations, a worked example from the mold to the embankment, field control and the mistakes that most distort the result.
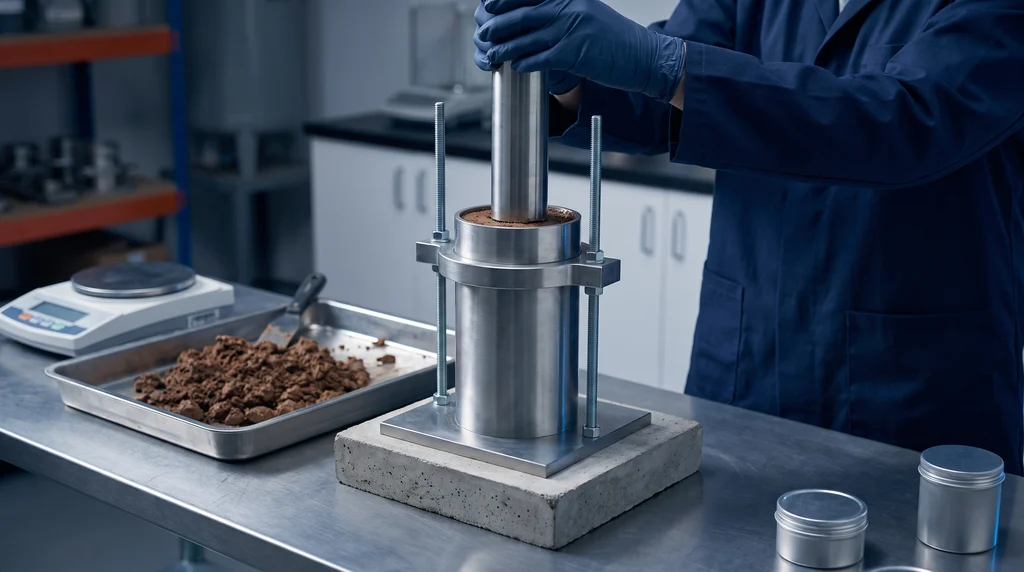
The photo shows the test performed by hand: the rammer runs inside the tubular guide resting on the soil, the mold is clamped to the base plate with the collar fitted on top, and the assembly sits on a concrete block, the rigid base that NBR 7182:2025 recommends so that the energy of each blow is not lost.
What soil compaction is in engineering
Soil compaction is the process in which mechanical energy applied rapidly, by impact, kneading or vibration, pushes the soil grains closer together and expels air from the voids, with no time for water to drain. The moisture content stays practically the same; what changes is the volume of air voids, and with it the dry density of the soil.
Compaction in one sentence
Compacting means increasing the dry density of a soil by expelling air, at nearly constant moisture content. This increase brings four effects that justify the work on any earthwork project: shear strength rises, compressibility drops (the embankment settles less once finished), permeability decreases and the soil becomes less sensitive to changes in moisture. A fill placed without control has large, irregular voids; the same soil, compacted in layers at the right moisture content, becomes an engineering material with predictable properties.
The quantity that measures the result is the dry density, ρd: the mass of solids per unit of total volume, in g/cm³. It is the wet (bulk) density with the water removed, ρd = ρ / (1 + w), with w as a decimal fraction. It is the dry density, not the wet density, that shows how much the soil has been densified, because the added water also has mass and would mask the result.
Where compaction is used
Compaction is part of every project that uses soil as a construction material. The most common cases:
- Highway and railway embankments: the body of the embankment and the final layers just below the pavement or the ballast;
- Pavement layers: subgrade, subgrade reinforcement, subbase and base, each with its own reference compaction effort;
- Earth dams: where the test originated, and where compaction controls the strength and permeability of the dam body;
- Industrial platforms, land developments and slabs on grade: where differential settlement cracks floors and masonry;
- Backfill of trenches and foundation pits: where soil returned without control settles and opens potholes in the pavement;
- Liner layers: such as compacted clay liners in landfills, where the main goal is low permeability.
In all of them, the design sets a minimum dry density and a moisture content range, and both targets come from the laboratory test. That is why, in civil engineering, soil compaction and the Proctor test are inseparable subjects.
Compaction is not consolidation
Both processes reduce voids, but through different mechanisms. Compaction expels air, in seconds, through energy applied by equipment, in an unsaturated soil. Consolidation expels water from a saturated soil under sustained load, over days or years, at a rate controlled by permeability. It is consolidation that makes an embankment on soft clay keep settling after it is built, and it is measured in the oedometer, as explained in the article on the consolidation test. A project may need both controls: compact the embankment properly and, underneath it, account for the consolidation of the clay foundation.
Soil compaction on the construction site and in the crop field
Soil compaction has two meanings that do not mix: on the construction site, it is the goal of a controlled operation; in the crop field, it is damage caused by traffic and trampling. The physical phenomenon is the same, a reduction in pore space, but the objective, the measurement and the remedy are opposite. The table summarizes the difference:
| Aspect | On the construction site (engineering) | In the crop field (agronomy) |
|---|---|---|
| Objective | It is the goal: increase strength and reduce settlement and permeability | It is damage: reduces aeration, infiltration and root growth |
| Cause | Roller compactor or rammer, with controlled energy, lift thickness and moisture content | Traffic of heavy machinery, especially on wet soil, and trampling by livestock |
| How it is measured | Proctor test in the laboratory and degree of compaction in the field | Soil bulk density and penetration resistance, assessed by agronomic methods |
| Remedy | Scarify the rejected layer, adjust the moisture content and recompact | Management: subsoiling, deep-rooted plants, traffic control |
On the construction site, the question "how do you fix soil compaction?" has an answer in the standards: DNIT 108/2009-ES (the specification of Brazil's National Department of Transport Infrastructure for embankments) requires that sections that do not reach the specified degree of compaction be scarified, homogenized, brought to the proper moisture content and compacted again. Readers who arrived here from the agronomic side will find the diagnosis and field management in the publication by Embrapa (the Brazilian Agricultural Research Corporation) Soil compaction and plant growth: how to identify, prevent and remedy it (in Portuguese). From here on, the subject is the engineering one.
The Proctor test: what it is for and where it comes from
The Proctor test, or Proctor compaction test, is the laboratory test that determines the relationship between the moisture content and the dry density of a soil compacted with a standardized effort. In Brazil it is governed by ABNT NBR 7182:2025, which calls it the compaction test; the name Proctor appears in the standard as the name of the small mold and, in everyday use, as a synonym for the whole test.
What the test delivers
The Proctor test delivers two numbers: the optimum moisture content (wót), the moisture content at which the soil reaches its highest dry density for that compaction effort, and the maximum dry density (ρd,máx), which is that highest density. When density is expressed as weight per volume, in kN/m³, it is called the maximum dry unit weight, γd,máx = ρd,máx · g: 1.720 g/cm³ is about 16.9 kN/m³. Both numbers come from the peak of the compaction curve, plotted with five points of increasing moisture content.
The reason there is a peak is physical. With little water, the grains of a fine-grained soil are held by suction and friction, and the energy of the rammer cannot rearrange them: the dry density stays low. As the moisture content rises, water reduces that friction, the grains slide and settle into place, and air escapes more easily. Beyond a certain point, however, water starts to fill the voids that air would leave, and water, practically incompressible, does not escape under rapid impact: the mass of solids per unit volume falls again. The peak separates the two behaviors, and the portions to its left and right are called the dry side and the wet side of optimum.
On site, both numbers become targets: the layer is compacted close to the optimum moisture content, and the dry density measured in the field is compared with the laboratory maximum. The same test is also used to mold the specimens for other tests, such as the CBR test, at the optimum moisture content.
Origin: Proctor, 1933
The method was presented by R. R. Proctor in 1933, in a series of four articles in the journal Engineering News-Record (v. 111), the first titled "Fundamental Principles of Soil Compaction". Proctor worked on earth dams in California and proposed a set of simple laboratory and field tests to select the soil, provide data for design and control construction layer by layer. The central idea, that there is a moisture content at which a given energy produces the densest soil, is still the basis of every compaction standard, Brazilian and foreign.
Compaction test standards: NBR 7182:2025, NBR 6457:2024, DNIT and ASTM
The Brazilian standard for the Proctor test is ABNT NBR 7182:2025, and sample preparation and moisture content follow ABNT NBR 6457:2024; on federal highway projects in Brazil, the DNIT test methods also apply. The editions and status below were checked on October 7, 2026: the ABNT standards in their full text (NBR 7182 and NBR 6457) or in the catalog entry (NBR 17212), the DNIT standards in the agency's standards collection (gov.br), and the ASTM standards in the ASTM store.
| Standard | Scope | Status as checked on October 7, 2026 |
|---|---|---|
| ABNT NBR 7182:2025 | Soils: compaction test (moisture content × dry density curve) | Current; 3rd edition, of February 17, 2025, cancels the 2016 edition |
| ABNT NBR 6457:2024 | Preparation of samples for compaction and characterization tests; moisture content | Current; 3rd edition, of January 9, 2024 |
| ABNT NBR 17212:2025 | Density of solids of the fraction passing the 2.0 mm sieve (used in the saturation curve) | Current, with an October 2025 errata (catalog entry) |
| DNIT 164/2013-ME | Soils: compaction using non-reused samples | Current; cancels DNER-ME 129/94 |
| DNER-ME 162/94 | Soils: compaction test using reused samples | In the current DNIT collection |
| DNIT 458/2025-ME | In-place density by the sand cone method | Current; approved on July 8, 2025, cancels DNER-ME 092/94 |
| DNIT 108/2009-ES | Earthworks: embankments (moisture content, degree of compaction, lift thickness) | Current, with Errata 1 incorporated |
| ASTM D698-12(2021) | Compaction using standard effort | Active |
| ASTM D1557-12(2021) | Compaction using modified effort | Active |
ABNT NBR 7182:2025
NBR 7182:2025 is the 3rd edition of the standard, published on February 17, 2025 by the Special Study Committee on Soils (ABNT/CEE-221), and it cancels and replaces the 2016 edition, declared technically revised. The 1986 and 2016 editions are no longer valid, and a new test report that cites either of them has an outdated reference. It is common to find, including in AI-generated summaries, the statement that the test "follows NBR 7182/1986": this is old information, copied from pages that were never updated.
The 2025 text does not list what changed relative to 2016. For this reason, claims in circulation that the new edition "now includes automated methods" or "criteria for digital equipment" have no support in the text of the standard. What NBR 7182:2025 says about equipment is simpler: manual compaction may be replaced by a mechanical system, provided it applies the same compaction efforts as the standard. One verifiable difference is the reference for the density of solids, which now points to NBR 17212.
ABNT NBR 6457:2024: preparation and moisture content
NBR 6457:2024 (the Brazilian standard for soil sample preparation and moisture content) is not the compaction test: it prepares the sample to be compacted and defines how to measure moisture content. For the Proctor test, it provides three preparation procedures: with prior air drying to close to the hygroscopic moisture content, with the sample at about 5% below the presumed optimum moisture content, or at about 3% above it. It also defines how much material to set aside, what to do with coarse particles and how to determine the moisture content by oven drying. The details are in the step-by-step procedure further below.
DNIT highway standards
On DNIT projects (Brazil's National Department of Transport Infrastructure), the compaction test follows DNIT 164/2013-ME, which revised and replaced DNER-ME 129/94. It uses the 152.4 mm mold with a spacer disk and non-reused samples (no reuse of material), and calls the three compaction efforts methods: Method A, standard, with 12 blows per layer; Method B, intermediate, with 26; and Method C, modified, with 55, always in 5 layers and with the 4.536 kg rammer dropping from 457.2 mm. These numbers match those of the large mold in NBR 7182:2025. The variant with reuse of material remains in DNER-ME 162/94. The correspondence between methods and efforts matters because the embankment specification, DNIT 108/2009-ES, still cites the old standard by the method names (A and B of DNER-ME 129/94); read today, they are the standard and intermediate efforts of DNIT 164/2013-ME. The reference "DNIT 164/03" also circulates, but it does not exist: the standard is from 2013. For fine-grained tropical soils, DNIT also has compaction in miniature equipment, the Mini-Proctor of the MCT methodology, standardized by DNIT 228/2023-ME, with 50 mm diameter specimens; it does not replace the full-size test in embankment specifications.
Equivalence with ASTM D698 and D1557
Outside Brazil, the standard Proctor test corresponds to ASTM D698 (standard effort) and the modified test to ASTM D1557 (modified effort), in editions D698-12(2021) and D1557-12(2021) respectively. ASTM states the energy of each: 600 kN·m/m³ in D698 and 2,700 kN·m/m³ in D1557. The principles are the same as in the NBR, but the detailed numbers are not: the smaller ASTM mold is 4 inches (101.6 mm) in diameter, compared with 100.0 mm in the NBR, and receives 25 blows per layer, compared with 26 in the NBR small mold. A test report that claims to follow NBR 7182 with 25 blows has mixed up the two standards.
Apparatus: molds, rammers and accessories
The compaction test apparatus consists of two standardized mold assemblies and two rammers, plus balances, sieves, a drying oven and handling accessories. The dimensions below are those of NBR 7182:2025 (the Brazilian standard for the soil compaction test), described in our own words.
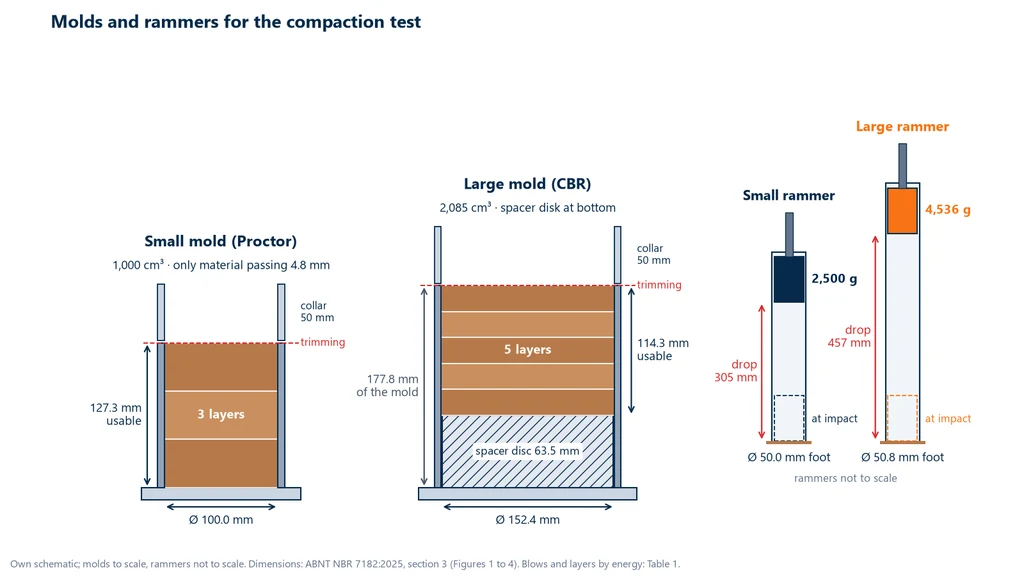
- Small mold (Proctor mold): inside diameter of 100.0 mm and effective height of 127.3 mm, which gives an effective volume of 1,000 cm³ (with a tolerance of 10 cm³). It has a base plate and a removable 50 mm high collar.
- Large mold (CBR mold): inside diameter of 152.4 mm and height of 177.8 mm; during compaction, a 63.5 mm high spacer disk sits at the bottom, leaving an effective height of 114.3 mm and an effective volume of 2,085 cm³ (tolerance of 22 cm³).
- Small rammer: mass of 2,500 g and drop height of 305 mm, with a 50.0 mm diameter striking face.
- Large rammer: mass of 4,536 g and drop height of 457 mm, with a 50.8 mm striking face.
- Balances: one of 10 kg with 1 g readability, for the mold and soil assembly, and another of 200 g with 0.01 g readability, for the moisture content containers.
- 19 mm and 4.8 mm sieves and a drying oven at 105 °C to 110 °C.
- Accessories: mixing pans, a beveled steel straightedge to trim the top, spatulas, graduated cylinders to measure the water, moisture containers, a specimen extruder, filter paper cut to the mold diameter and a rigid base, preferably concrete, on which the mold rests during compaction.
The diagram below shows the two molds to scale, side by side, with their effective heights, the spacer disk of the large mold and the 50 mm collar that holds the excess soil; next to them, not to scale, are the two rammers, with the raised mass and the position at impact that define the drop height.
When to use the large mold
The small mold may only be used when the prepared sample passes entirely through the 4.8 mm sieve. If the soil contains gravel retained on that sieve, the test moves to the large mold, whose larger diameter accommodates the particles without them jamming the rammer or distorting the volume. The large mold is also mandatory when the specimen will go on to the CBR test, because the CBR test is performed in the same 152.4 mm mold, with the space left by the spacer disk later used for the surcharge.
Mechanical compactor
NBR 7182:2025 allows the manual rammer to be replaced by a mechanical compactor, provided it applies the energies specified in the standard. In practice, the equipment must reproduce the mass, the drop height, the number of blows and the distribution of blows over the layer. The advantage is removing operator-to-operator variation from the result, such as a drop height that shortens at the end of a working day or blows concentrated in the center of the mold. The mechanical compactor does not change the method: it only changes who delivers the blows.
Compaction energies: standard, intermediate and modified
Compaction energy is the work applied to the soil per unit volume of the mold, resulting from the rammer mass, the drop height, the number of blows per layer and the number of layers. NBR 7182:2025 defines three levels, standard (normal), intermediate and modified, and for each mold it sets the rammer, layers and blows that produce each level. The higher the energy, the denser the soil can become.
The standard does not state the energy in kJ/m³. The values in the last column of the tables below were calculated by Biopdi using the expression E = m · g · h · N · n / V, where m is the rammer mass, g = 9.807 m/s², h the drop height, N the blows per layer, n the number of layers and V the effective volume of the mold. In the small mold:
| Energy | Rammer | Layers × blows | Calculated energy |
|---|---|---|---|
| Standard | Small: 2,500 g, 305 mm | 3 × 26 | ≈ 583 kJ/m³ |
| Intermediate | Large: 4,536 g, 457 mm | 3 × 21 | ≈ 1,281 kJ/m³ |
| Modified | Large: 4,536 g, 457 mm | 5 × 27 | ≈ 2,744 kJ/m³ |
In the large mold, all three energies use the large rammer, in 5 layers, and only the number of blows changes:
| Energy | Rammer | Layers × blows | Calculated energy |
|---|---|---|---|
| Standard | Large: 4,536 g, 457 mm | 5 × 12 | ≈ 585 kJ/m³ |
| Intermediate | Large: 4,536 g, 457 mm | 5 × 26 | ≈ 1,268 kJ/m³ |
| Modified | Large: 4,536 g, 457 mm | 5 × 55 | ≈ 2,681 kJ/m³ |
Comparing the two tables shows the logic of the standard: the blows for each mold were chosen so that both deliver practically the same energy per volume at each level, with a difference of at most 2.3%. The modified energy is about 4.7 times the standard energy, and the intermediate is around 2.2 times. That is why an energy should always be quoted together with the mold: "26 blows" is the standard energy in the small mold and the intermediate energy in the large one.
The calculation of the standard energy in the small mold, step by step: each blow delivers m · g · h = 2.5 kg × 9.807 m/s² × 0.305 m = 7.478 J. There are 26 blows in 3 layers, 78 blows in total, or 583.3 J. Divided by the volume of 0.001 m³, this gives 583 kJ/m³. With the large rammer, each blow delivers 4.536 × 9.807 × 0.457 = 20.33 J, almost three times as much.
How many blows does the standard Proctor test have?
The standard Proctor test of NBR 7182:2025 has 26 blows per layer, in 3 layers, with the small rammer in the small mold; in the large mold, it has 12 blows per layer, in 5 layers, with the large rammer. The "25 blows" found in many reports and web pages come from ASTM D698, which uses a different mold. Under the NBR, 25 blows in the small mold apply about 4% less energy than the standard requires.
Intermediate Proctor
The intermediate Proctor test applies about 1,270 to 1,280 kJ/m³. In the small mold, it uses 3 layers of 21 blows, and here is a detail few texts explain: the intermediate energy in the small mold already uses the large rammer, of 4.536 kg with a 457 mm drop. Only the standard energy uses the small rammer. In the large mold, the intermediate energy has 5 layers of 26 blows, which is Method B of DNIT 164/2013-ME (the Brazilian highway agency's compaction test method).
Modified Proctor
The modified Proctor test is the highest energy in the standard: 5 layers of 27 blows with the large rammer in the small mold, or 5 layers of 55 blows in the large mold, Method C of DNIT 164/2013-ME. It represents compaction by heavy equipment in pavement base layers, and gives the same soil a higher ρd,máx and a lower optimum moisture content than the standard energy.
Standard vs. modified Proctor and NBR vs. ASTM
The difference between the standard and modified Proctor tests lies in the energy: the modified test applies about 4.7 times more work per volume, with a heavier rammer, a higher drop and more layers. The table compares the NBR standard energy with the two ASTM standards:
| Item | NBR 7182:2025, standard, small mold | ASTM D698-12(2021) | ASTM D1557-12(2021) |
|---|---|---|---|
| Mold | Ø 100.0 mm, 1,000 cm³ | Ø 101.6 mm (4 in) or 152.4 mm (6 in) | Ø 101.6 mm (4 in) or 152.4 mm (6 in) |
| Rammer and drop | 2,500 g, 305 mm | 24.5 N (about 2.5 kg), 305 mm | 44.48 N (about 4.54 kg), 457.2 mm |
| Layers × blows | 3 × 26 | 3 × 25 (4 in) or 3 × 56 (6 in) | 5 × 25 (4 in) or 5 × 56 (6 in) |
| Energy | ≈ 583 kJ/m³ (Biopdi calculation) | 600 kN·m/m³ (stated) | 2,700 kN·m/m³ (stated) |
The energies are close but not identical, and the results from a laboratory following the NBR and another following ASTM may differ in the third decimal place of ρd,máx. The test report should state the standard followed and must not mix the dimensions of one with the blows of the other.
Which energy to use
The test energy is chosen to represent the compaction that the equipment will apply on site, and it is set by the specification or the design. In earthworks, DNIT 108/2009-ES (the Brazilian highway agency's embankment specification) uses the standard energy for the embankment body and the intermediate energy for the top layers. In pavement layers, the CBR test under DNIT 172/2016-ME associates the three energies with the subgrade, subbase and base, as detailed in the article on the CBR test. Testing at one energy and requiring the degree of compaction at another is one of the costliest mistakes on site: the target ends up too high or too low.
How to perform the Proctor test, step by step
The Proctor test is performed in three stages: preparing the sample according to NBR 6457:2024 (the Brazilian standard for soil sample preparation), compacting five points of increasing moisture content according to NBR 7182:2025, and calculating the dry density of each point to plot the curve. The first two are covered in this section; the calculations come in the next one.
Sample preparation
In the most common procedure, the sample is air-dried to close to its hygroscopic moisture content, not oven-dried: the oven is used only to measure moisture, because drying the soil at 105 °C before compaction can alter the structure of tropical soils. The clods are then broken up without crushing the grains, in a mortar with a rubber-covered pestle, and the sample is reduced by riffle splitter or quartering to a representative portion.
The sample is then passed through the 4.8 mm sieve. Under NBR 6457:2024, what happens to the retained material depends on the amount:
- Less than 7% retained on the 4.8 mm sieve: the retained material is discarded, and the test can use either the small or the large mold;
- Less than 10% retained on the 19.1 mm sieve: test in the large mold, with the retained material discarded;
- Between 10% and 30% retained on the 19.1 mm sieve: large mold, with the material between 19.1 and 76.2 mm replaced by an equal mass of material between 4.8 and 19.1 mm;
- More than 30% retained on the 19.1 mm sieve: the standard recommends not testing under NBR 7182, because the result no longer represents the material.
The amount of sample depends on the mold and on reuse. With reuse of the material, 3 kg of dry mass is enough for the small mold and 7 kg for the large one; without reuse, 15 kg and 35 kg are needed, because each of the five points uses a fresh portion. NBR 7182 refers to the "19 mm" sieve and NBR 6457 to the "19.1 mm" sieve: it is the same sieve.
With or without reuse: the five variants
NBR 7182:2025 combines the three preparation procedures of NBR 6457 with reuse or no reuse of the material, resulting in five method variants. With reuse, the same soil is compacted, broken up and recompacted with more water at each point; without reuse, the sample is divided into five equal portions, each compacted only once and then discarded:
| Clause | Reuse | Sample preparation | How moisture is varied |
|---|---|---|---|
| 5.1 | With | Prior drying to hygroscopic moisture content | Water to ~5% below the estimated optimum; then +2% per point |
| 5.2 | Without | Prior drying to hygroscopic moisture content | Five portions, the 1st ~5% below the optimum, each 2% above the previous one |
| 5.3 | With | Sample at ~5% below the estimated optimum | Starts with no added water; then +2% per point |
| 5.4 | Without | Sample at ~5% below the estimated optimum | 1st portion with no added water, the others 2% above the previous one |
| 5.5 | Without | Sample at ~3% above the estimated optimum | 1st portion with no adjustment, the others 2% below, by air-drying |
Reuse saves material, but each cycle of compaction and breaking up can crush grains and change the particle size distribution. In soils with friable grains, such as many lateritic soils with concretions, and in soils whose structure changes when they dry, the no-reuse variants give a more faithful result. The variants that start from the moist sample (5.3 to 5.5) avoid prior drying, which is useful when drying would alter the soil.
Procedure
In the variant with reuse and prior drying, which serves as the basis for the others, each point on the curve follows this sequence:
- Assemble the mold: fasten the mold to the base plate, fit the collar and place the assembly on the rigid base; in the large mold, place the spacer disk at the bottom. A sheet of filter paper on the base plate or the disk prevents the soil from sticking to the metal.
- Moisten: in the pan, add distilled water gradually with the graduated cylinder, mixing until the moisture is uniform, about 5% below the estimated optimum. If the water does not distribute evenly, which is common in clays, the standard recommends leaving the sample for 24 hours in a sealed plastic bag in a moist room and mixing it again before compaction.
- Compact: place the soil in layers of approximately equal height and apply the blows of the chosen energy, with the rammer in free fall, perpendicular to the surface and with the blows distributed over the whole area. Before placing the next layer, lightly scarify the surface of the previous one so that the layers bond.
- Trim: loosen the soil along the wall, remove the collar and check the excess above the mold, which must not exceed 10 mm. The excess is removed and the top is trimmed with the beveled straightedge; in the small mold, the bottom face is also trimmed.
- Weigh: weigh the assembly to 1 g and obtain the wet soil mass, Mu, by subtracting the mass of the mold.
- Take the moisture sample: extrude the specimen and take a sample from its center for moisture content, according to NBR 6457:2024. If the specimen is going on to another test, such as CBR, unconfined compression or permeability, the moisture sample is taken from a portion in the pan right after compacting the 2nd layer.
- Prepare the next point: break up the specimen, return it to the pan, add water to raise the moisture content by about 2% and repeat.
Oven moisture content follows NBR 6457:2024: the container goes uncovered into the oven at 105 °C to 110 °C until constant mass, which usually takes 16 to 24 hours, cools in a desiccator and is weighed again. Organic soils, peaty soils or soils containing gypsum are dried at 60 °C to 65 °C, and the report states that temperature.
How many points the curve has
NBR 7182:2025 specifies five points: two on the dry side, one close to the optimum moisture content, preferably still on the dry side, and two on the wet side. The step of about 2% between points spreads the five across the curve without missing the peak. If the third point already falls clearly on the wet side, the estimated moisture content was too high, and the curve ends up with only one or two points before the peak, which leaves the peak poorly defined.
Calculations: dry density, compaction curve and saturation curve
The Proctor test calculation turns the mass of moist soil in the mold and the measured moisture content of each point into dry density. The five pairs give the compaction curve, and its peak gives the optimum moisture content and ρd,max. Only a few formulas are needed:
- Moisture content (NBR 6457:2024, the Brazilian standard for soil sample preparation and moisture content): w = (M1 − M2) / (M2 − M3) × 100, in %. M1 is the container with moist soil, M2 the container with dry soil and M3 the empty container. This is moisture content on a dry basis: mass of water divided by mass of solids.
- Dry density (NBR 7182:2025, the Brazilian standard for the soil compaction test): ρd = Mu × 100 / [V × (100 + w)], in g/cm³. Mu is in g, V is the net volume of the mold in cm³ and w is in %. This is the same relation as ρd = ρ / (1 + w), written with w as a percentage.
- Saturation curve: ρd,sat = ρs / (1 + w · ρs / ρw), with w as a fraction, ρs the density of soil solids, determined per NBR 17212 (the Brazilian standard for this determination), and ρw = 1.00 g/cm³. NBR 7182:2025 gives the general form, with the degree of saturation S, and recommends plotting the S = 100% curve on the same graph.
- Degree of saturation of a point: S = w · ρs / (e · ρw), with the void ratio e = ρs / ρd − 1. The standard does not require this calculation, but it shows how much air is still left in the soil.
How to read the curve
The compaction curve is plotted with moisture content on the horizontal axis and dry density on the vertical axis, and NBR 7182:2025 states that it should be roughly parabolic in shape. ρd,max is the ordinate of the highest point, reported to the nearest 0.001 g/cm³, and the optimum moisture content is the abscissa of that point, reported to 0.1%. The peak is a maximum, not an "inflection point" as some pages describe it: an inflection point is where the curvature changes direction, which happens on the branches, not at the top.
The saturation curve works as a physical limit. A compacted soil always retains some air, so no point can lie above the S = 100% curve. On the wet side, the compaction curve runs roughly parallel to the saturation curve, with an almost constant degree of saturation, because the remaining air is trapped and the rammer cannot expel it. A point above the saturation curve indicates an error in the moisture content, the mold volume or the assumed ρs.
Soil type changes the position of the peak. Well-graded granular soils, with sand and gravel, reach high dry densities at low moisture contents and give sharper curves; clays and silts reach lower dry densities at higher optimum moisture contents and give flatter curves. Clean sands without fines usually give poorly defined curves, and for them control by relative density is the usual approach. "Typical" numerical ranges by soil type circulate in course notes without a verifiable source; at most they help check whether a result is plausible, and they never replace the test.
Effect of compaction effort
More effort makes the same soil denser with less water: the curve rises and shifts to the left. The explanation is the same as for the peak: with more blows, the energy overcomes friction between the grains with less lubrication. The optimum points for the different efforts fall on a line that follows the saturation curve, called the line of optimums, and on the wet side the curves for the three efforts converge, because there the density is limited by water, not by effort. The graph below shows this behavior with illustrative curves for a single soil, not with test results:
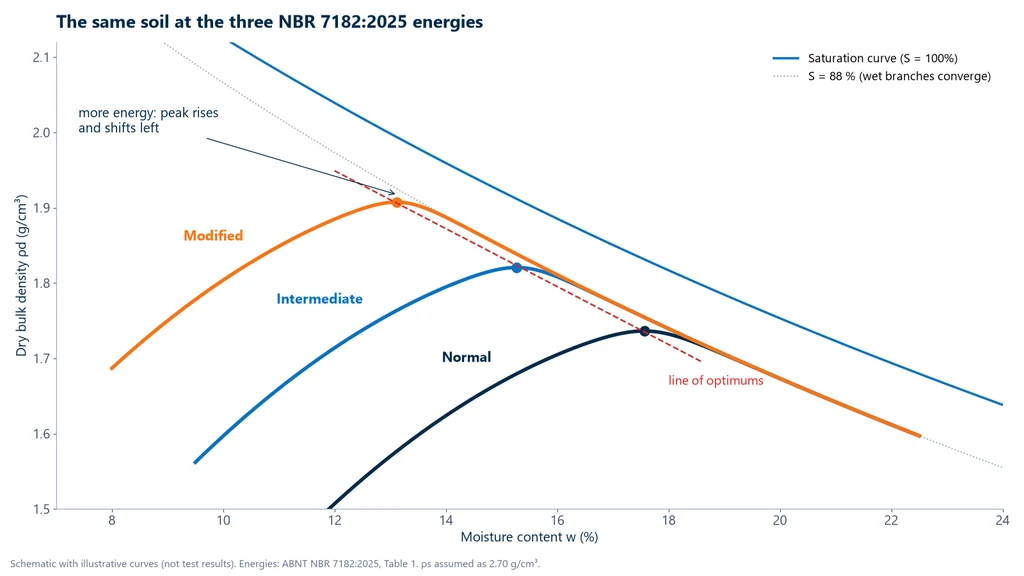
The practical consequence is that more compaction does not always solve the problem. A soil placed well above the optimum moisture content, on the wet side, does not gain density with more roller passes: the extra energy only makes the "spongy" soil pump and wave under the equipment. The fix in this case is to dry the soil, not to keep compacting.
Structure of compacted soil
In clays, the side of the curve on which the soil was compacted changes its structure, not just its density. On the dry side, particles tend toward a flocculated structure, stiffer and more permeable; on the wet side, they tend toward a dispersed structure, less permeable and more deformable. This is why the core of an earth dam is usually compacted slightly above optimum, where permeability is lower, while a layer that needs stiffness is compacted near optimum or slightly below.
Worked example: from the mold to the optimum moisture content
The following example goes through a complete standard-effort test in the small mold, 1,000 cm³, with soil reuse and prior drying (variant 5.1). The empty mold weighs 4,350 g. For the saturation curve, ρs = 2.70 g/cm³ is assumed; in a real test it would come from NBR 17212. All numbers were calculated by Biopdi.
Step 1: how much water to add
The air-dried sample weighs 3,000 g and has a hygroscopic moisture content of 3.5%. The presumed optimum moisture content, based on experience with a similar soil, is 16.5%, so the first point should be near 11.5%, about 5% below. The mass of solids is Ms = 3,000 / 1.035 = 2,898.6 g. The water to add is Ms × (0.115 − 0.035) = 2,898.6 × 0.080 = 231.9 g, or about 232 cm³ of distilled water. Each subsequent 2% increase requires 2,898.6 × 0.02 = 58 g of water.
Step 2: dry density of each point
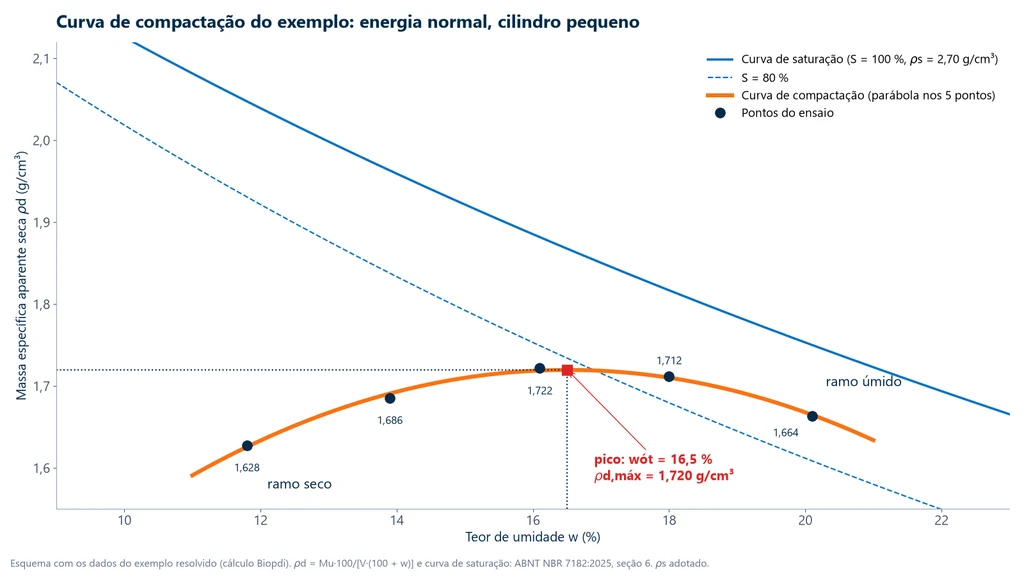
The five points gave these masses and moisture contents. For the first, the mold and soil weighed 6,170 g, so Mu = 6,170 − 4,350 = 1,820 g, the wet density is 1,820 / 1,000 = 1.820 g/cm³ and ρd = 1,820 × 100 / [1,000 × (100 + 11.8)] = 182,000 / 111,800 = 1.628 g/cm³. The others follow the same calculation:
| Point | Mold + soil (g) | w (%) | ρd (g/cm³) |
|---|---|---|---|
| 1 | 6,170 | 11.8 | 1.628 |
| 2 | 6,270 | 13.9 | 1.686 |
| 3 | 6,349 | 16.1 | 1.722 |
| 4 | 6,370 | 18.0 | 1.712 |
| 5 | 6,348 | 20.1 | 1.664 |
Note that the wet mass keeps rising from point 3 to point 4, from 1,999 to 2,020 g, but the dry density is already falling: the added water weighs more than the gain in solids. This is why the curve uses ρd and not the wet mass. The set meets the standard: two points on the dry side (1 and 2), one near optimum, still on the dry side (3), and two on the wet side (4 and 5).
Step 3: the peak of the curve
A parabola fitted to the five points by least squares has its vertex at wopt = 16.5% and ρd,max = 1.720 g/cm³. If the parabola passed only through the three top points (2, 3 and 4), the vertex would be at 16.6% and 1.723 g/cm³. The difference of 0.003 g/cm³ shows that the plotting method affects the third decimal place, so the laboratory should always use the same method and state it. The graph shows the five points, the parabola, the peak and the 100% and 80% saturation curves:
Step 4: check against the saturation curve
With ρs = 2.70 g/cm³, the saturation curve at the five moisture contents gives 2.048, 1.963, 1.882, 1.817 and 1.750 g/cm³. All points lie below it. At point 5, for example, ρd,sat = 2.70 / (1 + 0.201 × 2.70) = 1.750 g/cm³, above the measured 1.664. The degree of saturation of each point tells the same story in numbers:
| Point | ρd (g/cm³) | ρd,sat (g/cm³) | S (%) |
|---|---|---|---|
| 1 | 1.628 | 2.048 | 48 |
| 2 | 1.686 | 1.963 | 62 |
| 3 | 1.722 | 1.882 | 77 |
| 4 | 1.712 | 1.817 | 84 |
| 5 | 1.664 | 1.750 | 87 |
At the peak, the void ratio is e = 2.70 / 1.720 − 1 = 0.570 and the degree of saturation is S = 0.165 × 2.70 / 0.570 = 78%: even in the densest condition, about one fifth of the voids is still air. On the wet side, S goes from 84% to 87% while moisture content rises by 2 points, the roughly parallel behavior to the saturation curve described in the calculations section.
The test result, expressed as the standard requires, is: ρd,max = 1.720 g/cm³ and wopt = 16.5%, standard effort, sample prepared with prior drying and tested with reuse. The NBR 7182:2025 report must state the preparation procedure and the compaction effort; without them, the number cannot be used as a field target.
Degree of compaction and field control of embankments
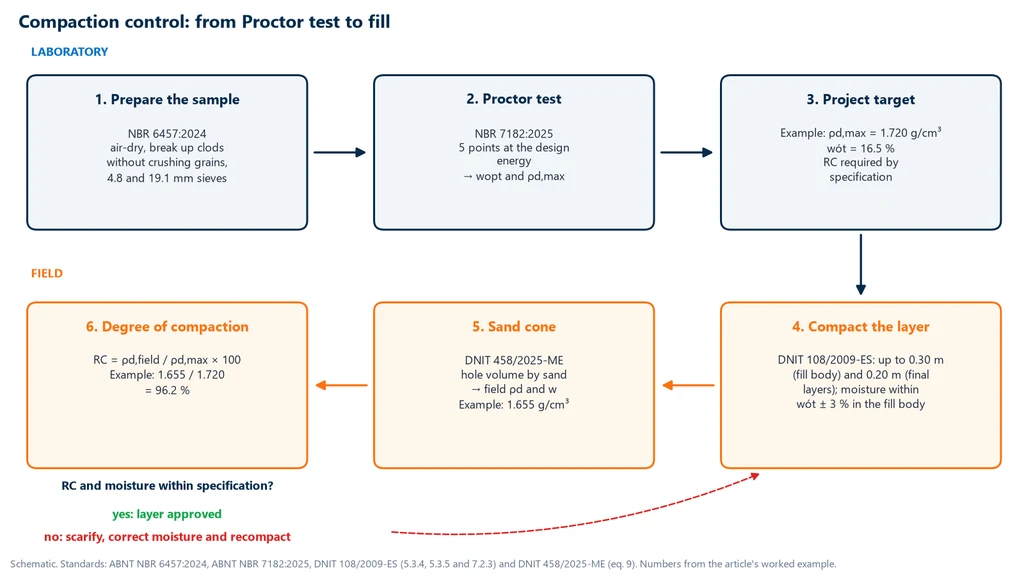
Degree of compaction (DC), also called relative compaction, is the ratio, in percent, between the dry density measured in the compacted layer and the laboratory maximum dry density of the same soil: DC = ρd,field / ρd,max × 100. It is the number that turns the Proctor test into an acceptance criterion for the job. The flowchart below shows the complete path, from the sample to acceptance of the layer, with the numbers from the example:
How to measure the degree of compaction
To measure the degree of compaction, the dry density of the layer is determined in the field and divided by the ρd,max from the Proctor test of the same material, at the effort required by the specification. The most widely used field method in Brazil is the sand cone method, standardized by DNIT 458/2025-ME (a Brazilian federal highway agency test method), which replaced DNER-ME 092/94. A hole is dug in the layer, all the soil removed is collected and weighed, and the volume of the hole is measured by filling it with a clean, uniform sand of known density, with grains between the No. 16 (1.18 mm) and No. 30 (0.59 mm) sieves. The mass of sand that fills the cone and the recess of the base plate is subtracted before the calculation. With the moisture content of the removed soil, the field dry density and the DC are calculated, with the DC reported to the nearest 0.1%.
There are other field methods, such as the drive cylinder method, for fine soils without gravel, and the Hilf method, which gives the degree of compaction without waiting for oven drying. What does not change is the reference: the DC is always compared with the Proctor test of the same soil at the same effort.
Example: did the layer pass?
In the embankment built with the soil from the example, the sand cone test gave: 3,180 g of moist soil removed from the hole, 2,295 g of sand in the hole (already excluding the sand in the cone and base plate), sand density of 1.40 g/cm³ and soil moisture content of 17.2%.
- Volume of the hole: V = 2,295 / 1.40 = 1,639.3 cm³.
- Wet density: ρ = 3,180 / 1,639.3 = 1.940 g/cm³.
- Dry density: ρd = 1.940 × 100 / (100 + 17.2) = 1.655 g/cm³.
- Degree of compaction: DC = 1.655 / 1.720 × 100 = 96.2%.
- Moisture deviation: 17.2 − 16.5 = +0.7 point relative to optimum.
DNIT 458/2025-ME requires densities with three significant figures in the report (1.66 g/cm³) and the DC to 0.1%; the calculation uses the unrounded values. The moisture content is within any usual tolerance. The degree of compaction, however, fails the layer if the job follows DNIT 108/2009-ES (the Brazilian federal specification for embankment earthworks), which requires a DC of at least 100%, and would pass it under a specification requiring 95%. The decision belongs to the project specification; the test only provides the number. If rejected, the layer is scarified, homogenized, brought to the proper moisture content and compacted again.
What degree of compaction the job requires
There is no universal degree of compaction: it is set by the specification of each job, together with the reference effort. DNIT 108/2009-ES, for embankment earthworks, is the federal reference in Brazil and ordinarily requires:
- Embankment body: optimum moisture content with a tolerance of ±3%, and a DC of at least 100% of standard effort (Method A);
- Final layers: DC of at least 100% of intermediate effort (Method B);
- Thickness: compacted layers of at most 0.30 m in the embankment body and 0.20 m in the final layers;
- Frequency of the reference Proctor test: one compaction test for every 1,000 m³ of embankment body material and every 200 m³ of final-layer material;
- Field control: number of in-situ density determinations defined by a statistical sampling plan, with at least five determinations in sections of limited volume.
State, municipal and private project specifications may adopt other limits, including degrees below 100% with higher effort. The field report must cite the specification used, the compaction effort and the reference Proctor test.
What is the ideal moisture content for compacting soil?
There is no ideal moisture percentage valid for every soil: the ideal moisture content is the optimum moisture content from the Proctor test of that soil, at the specified effort, with whatever tolerance the specification allows. In the example, it is 16.5%; in another soil, it may be 9% or 28%. Compacting on the dry side, below optimum, gives a stiffer soil, but one that may swell and lose strength when it gets wet; compacting well above optimum, on the wet side, prevents the soil from reaching the required degree of compaction.
From the Proctor test to CBR and other soil tests
Besides being a field control test, the Proctor test is the step that molds the test specimens for several mechanical soil tests, at the optimum moisture content and the design compaction effort. This is why it almost never stands alone in the laboratory.
The most common case is the CBR test (California Bearing Ratio). The specimens are compacted in the large mold, on top of the spacer disk. In this case, NBR 7182:2025 (the Brazilian standard for soil compaction testing) requires the moisture content to be taken from a portion of the material in the tray right after the 2nd layer, because the whole specimen goes on to soaking and penetration. The CBR test measures the bearing capacity of the compacted soil relative to a standard crushed stone. It is the basis for accepting layers and for pavement design, and the full procedure is in the CBR article. Compacted soil is also tested in the triaxial test and the direct shear test to obtain the strength parameters of embankments and dams. It is also used in the unconfined compression test, which is a compression test without confinement on a cylindrical test specimen.
The Biopdi CBR test press
Biopdi manufactures the CBR/Marshall test press, which receives the specimen compacted in the large mold and performs the CBR penetration. It is a 50 kN (11,240 lbf) press available in two models, manual and electric automatic. On the electric automatic version, speed control ranges from 0.001 to 50 mm/min, which covers the 1.27 mm/min CBR penetration rate. The same press runs the Marshall test on asphalt mixtures and, in the automatic version, the consolidation test. Biopdi does not manufacture the Proctor mold, rammer or compactor: the link between the two tests is the specimen. The panel below shows the press and what each part does in the test that follows compaction:
The CBR/Marshall test press after compaction
The specimen molded at the optimum moisture content in the large mold goes to the 50 kN (11,240 lbf) press. Each part has a role in the CBR penetration:
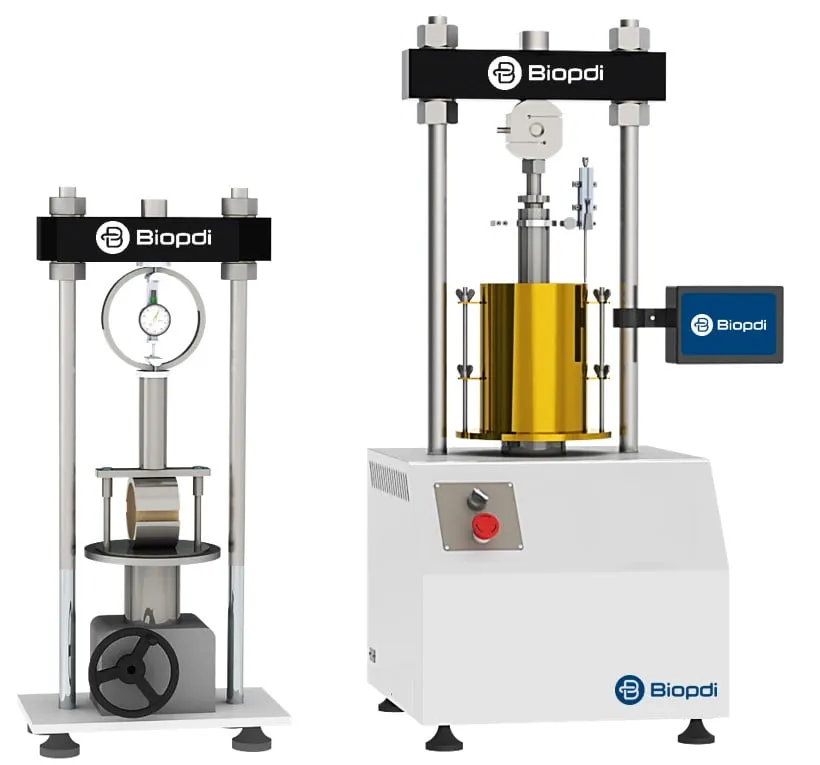
- Two models, manual and electric automatic, both with the CBR and Marshall fixtures
- Speed control from 0.001 to 50 mm/min on the automatic version, which covers the 1.27 mm/min CBR rate
- Interchangeable load cell from 5 to 5,000 kgf (0.049 to 49 kN)
- 50 mm LVDT with 0.01 mm resolution for penetration
- 100 mm stroke with automatic return at the end of the test
The other equipment in the line, such as the consolidation, direct shear and triaxial presses, is listed under soil testing equipment.
Common mistakes in the compaction test
Most discrepancies between laboratories in the Proctor test come from details of execution and from mixed-up references, not from the calculation. These are the mistakes that show up most often in reports and technical pages:
- Using 25 blows in the NBR standard Proctor. The small mold calls for 26 blows per layer. The 25 blows belong to ASTM D698, which uses a different mold.
- Mixing the ASTM mold with the ABNT standard. The 4-inch (101.6 mm) mold is not the 100.0 mm, 1,000 cm³ mold of NBR 7182:2025. The mold volume goes straight into the calculation of ρd.
- Citing the 1986 or 2016 edition of NBR 7182 as current. The edition in force is the 2025 one.
- Citing NBR 7181 as the Proctor standard. NBR 7181 covers particle size analysis. The compaction standard is NBR 7182.
- Using the small mold with gravel. The prepared sample must pass entirely through the 4.8 mm sieve. If the material retained exceeds the limits of NBR 6457:2024 (the Brazilian standard for soil sample preparation), the test moves to the large mold.
- Oven-drying the sample before compaction. Preliminary drying is air drying. The oven alters tropical soils and is used only to measure moisture content.
- Compacting with poorly distributed moisture. Freshly wetted clays have clods that are still dry inside. The standard recommends 24 hours in a moist room.
- Leaving more than 10 mm of excess soil, or trimming without the beveled straightedge. The mass Mu comes out wrong and the whole point shifts.
- Taking the moisture sample from the edge of the specimen. It should come from the center, or from the tray when the specimen goes on to the CBR test.
- Reusing material with friable or lateritic soil. Particle breakage changes the curve. The no-reuse variants (5.2, 5.4 and 5.5) exist for this reason.
- Accepting a point above the saturation curve. It is physically impossible and points to an error in moisture content, volume or ρs.
- Calling the peak an "inflection point". The peak is the maximum of the curve.
- Reading "305 cm" in the rammer figure. The caption of the rammer figures in NBR 7182:2025 itself gives the unit as "cm". The correct values, given in the text of section 3, are 305 mm and 457 mm.
- Confusing degree of compaction with relative density. The degree of compaction is measured against the Proctor result. Relative density, used for sands, is measured against the maximum and minimum void ratios.
Conclusion
Compacting a soil means increasing its dry density by expelling air. For each soil and each compaction effort, the Proctor test tells you how far you can go and at what moisture content. Under NBR 7182:2025, that means five well-distributed points, the right effort in the right mold, the moisture sample taken from the right place, and the saturation curve as a check. In the field, the degree of compaction measured with the sand cone closes the cycle and decides whether the layer stays or is redone, always against the project specification.
The tests that use compacted soil have their own articles: the CBR test, the triaxial test, the direct shear test and the consolidation test. To choose the equipment for mechanical soil testing in your laboratory, talk to one of our specialists.
Other tests and technical references
NBR 6457:2024: soil sample preparation and moisture content
ABNT NBR 6457:2024 guide: preparing soil samples for compaction and characterization, masses per test, and oven-dry moisture content with calculation.
Soil particle size analysis: sieve and hydrometer test and gradation curve per NBR 7181
Soil particle size analysis per NBR 7181:2025: sieving, hydrometer sedimentation, gradation curve, D10, Cu and Cc, NBR 6502 fractions, worked example.
CBR test and the California Bearing Ratio
CBR test (California Bearing Ratio): NBR 9895:2025 and DNIT 172 standards, procedure, formula with 6.9 and 10.35 MPa, worked example and CBR by layer.
Direct shear test: ASTM D3080 standard, step-by-step procedure and how to calculate c' and φ'
The direct shear test measures soil shear strength and gives the cohesion c' and friction angle φ'. ASTM D3080-23, step by step, with a worked example.
Frequently asked questions
What is the ABNT standard for soil compaction?
It is ABNT NBR 7182:2025, Soils: Compaction test, 3rd edition, dated February 17, 2025, which canceled the 2016 edition. Sample preparation and moisture content follow ABNT NBR 6457:2024. For Brazilian federal highway works, DNIT 164/2013-ME (test method of DNIT, Brazil's federal transportation infrastructure agency) also applies to the test, and DNIT 108/2009-ES to embankment control. The standard Proctor is the standard effort of these same standards, not a separate standard.
What is the Proctor test used for?
The Proctor test is used to determine the optimum moisture content and the maximum dry density of a soil at a standardized compaction effort. These two values are the target for field compaction, the reference for the degree of compaction and the molding condition for specimens in tests such as CBR.
What is the Proctor method?
It is the method of compacting soil in a standardized mold, in layers, with a rammer of fixed mass and drop height, repeated at five moisture contents to plot the moisture content × dry density curve. It was proposed by R. R. Proctor in 1933 to control earth dams and is now specified in NBR 7182:2025.
How many blows does the standard Proctor test have?
Under NBR 7182:2025, the standard Proctor test uses 26 blows per layer, in 3 layers, with the 2,500 g rammer and a 305 mm drop in the 1,000 cm³ mold. In the large 2,085 cm³ mold, it uses 12 blows in 5 layers with the 4,536 g rammer. The 25 blows belong to ASTM D698.
What is the difference between standard, intermediate and modified Proctor?
The compaction effort. In the small mold, the standard effort uses the small rammer at 3 × 26 blows (about 583 kJ/m³), the intermediate effort uses the large rammer at 3 × 21 (about 1,281 kJ/m³) and the modified effort uses the large rammer at 5 × 27 (about 2,744 kJ/m³), as calculated by Biopdi. More energy gives a higher dry density and a lower optimum moisture content.
How do you calculate soil compaction?
In the laboratory, you calculate the dry density of each point, ρd = Mu × 100 / [V × (100 + w)], and read the peak of the curve. In the field, you calculate the degree of compaction, GC = ρd,campo / ρd,máx × 100. With ρd,campo = 1.655 g/cm³ and ρd,máx = 1.720 g/cm³, the degree of compaction is 96.2%.
How do you measure the degree of compaction of soil?
You measure the dry density of the layer in the field, usually with the sand cone method of DNIT 458/2025-ME, divide it by the maximum dry density from the Proctor test of the same soil at the specified effort, and multiply by 100. The result is reported to the nearest 0.1%.
What is the ideal soil moisture percentage for compaction?
It is the optimum moisture content from the Proctor test of that soil, which varies from soil to soil, within the tolerance of the specification. DNIT 108/2009-ES allows 3% above or below the optimum in the body of the embankment. There is no single value that applies to all soils.
What causes soil compaction?
On a construction site, compaction is caused deliberately by equipment that applies energy through impact, kneading or vibration, such as rollers and rammers, in layers of controlled thickness. In farming, it is caused unintentionally by heavy machinery traffic, especially when the soil is wet, and by animal trampling.
What is the ABNT NBR 7181 standard?
NBR 7181 is the Brazilian standard for particle size analysis of soils, by sieving or by sedimentation combined with sieving, not for the compaction test. The current edition is NBR 7181:2025, 3rd edition, dated January 15, 2025, with a corrected version dated July 13, 2026. The Proctor standard is NBR 7182.
What is the purpose of the CBR test?
The CBR test measures the bearing capacity of a compacted soil, as a percentage of the resistance of a standard crushed stone to the penetration of a piston, after four days of soaking. The specimens are molded at the Proctor optimum moisture content in the large mold. The full test is covered in the CBR test article.
How do you correct soil compaction on site?
A layer that did not reach the required degree of compaction is scarified, homogenized, brought to the proper moisture content and compacted again, as required by DNIT 108/2009-ES. If the problem is excess water, the soil must dry first, because more roller passes on the wet side do not increase density.