
Soil particle size distribution (grain size distribution, or gradation) describes how the mass of a soil is split among grain sizes. ABNT NBR 7181:2025, the Brazilian standard for particle size analysis of soils, measures it in two ways: sieve analysis for grains larger than 0.075 mm and hydrometer sedimentation for the fines. The result is the particle size distribution curve. From it you get the soil fractions, the diameters D10, D30 and D60, and the coefficients Cu and Cc. It is the first characterization test for any soil that will become an embankment fill, a pavement layer or a foundation bearing stratum. It is also the starting point for classifying the soil and choosing the next tests.
The term particle size distribution is also used for concrete aggregate and in agronomy, but there the test, the size ranges and the result are different. This guide covers soil for engineering, and the differences are summarized in the section soil, aggregate and agronomic texture. The guide covers the concept, the fractions defined by NBR 6502:2022, the standard (current edition checked on October 7, 2026), the apparatus, the step-by-step procedure, Stokes' law, the calculations, how to read the curve, the gradation coefficients, a worked example and the errors that distort the result most.
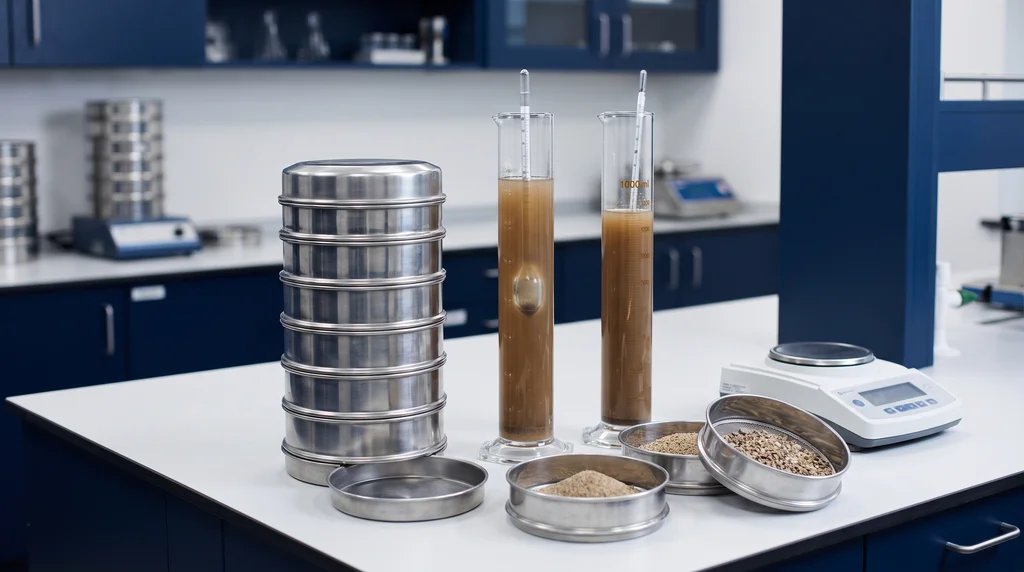
The photo shows both methods side by side: the sieve stack with the lid on top, sieves holding the sand and gravel fractions already separated, two sedimentation cylinders with the hydrometer floating in the soil suspension, and the balance used to weigh each fraction.
What soil particle size distribution is and what it is used for
Soil particle size distribution, or particle size analysis, gives the percentage of dry mass in each grain size range of a soil. Grain sizes run from boulders down to clay particles smaller than 0.002 mm, and no single method covers that whole range. That is why the test combines two methods.
Particle size distribution in one sentence, and the equivalent diameter
Particle size distribution answers one question: "how much of this soil, by mass, is finer than each diameter?" The word "diameter" means different things in the two methods. For coarse grains, it is the opening of the sieve mesh the grain passes through. A grain that passes the 0.42 mm sieve and is retained on the 0.25 mm sieve has a diameter between those two values. Fines cannot be sieved reliably, so their diameter is calculated from the speed at which the grain settles in water, using Stokes' law. This is the equivalent diameter: the diameter of a sphere of the same material that would settle at the same speed. A clay particle is plate-shaped, so its equivalent diameter does not measure the real particle. It is a convention that allows soils to be compared.
What particle size distribution is used for
The particle size distribution curve feeds almost every decision about a construction soil:
- Classification: the Unified Soil Classification System (USCS, ASTM D2487) and the TRB/HRB highway system use the particle size distribution, together with the liquid limit and plastic limit, to assign the soil a group and a name;
- Preparing other tests: under NBR 6457:2024 (the Brazilian standard for soil sample preparation), the amount retained on the 4.8 mm and 19.1 mm sieves decides the mold used in the Proctor test and how the coarse grains are handled;
- Drainage and permeability: D10, called the effective size, is the basis of empirical permeability correlations for sands, such as Hazen's, and the characteristic diameters are used to design filters and drains;
- Pavement engineering: subbase and base specifications accept or reject materials by gradation envelopes, and the same idea of envelopes appears in asphalt mixes designed with the Marshall test;
- Predicting behavior: well-graded soils compact better and reach higher dry densities; uniform sands drain well but compact poorly; silty soils are sensitive to water and erosion.
The curve has a clear limit. In fine-grained soils, where more than half the mass passes the 0.075 mm sieve, behavior depends more on the type of clay mineral and on the water than on grain size. Two soils with the same curve can have very different plasticity. For these soils the Atterberg limits decide the classification, and the particle size distribution becomes supporting data.
Soil fractions according to NBR 6502:2022
Soil fractions are the size ranges that have their own names: gravel, sand, silt and clay. In Brazil, the fraction boundaries come from ABNT NBR 6502:2022, the Brazilian terminology standard for soils and rocks. NBR 7181:2025 does not define fractions or classify the soil. It only measures the distribution and requires it to be presented as a curve. The table summarizes the four main fractions:
| Fraction | Grain diameter | How NBR 7181:2025 measures it |
|---|---|---|
| Gravel | from 2.0 mm to 60 mm | Coarse sieving (50 to 2.0 mm) |
| Sand | from 0.06 mm to 2.0 mm | Fine sieving (1.2 to 0.075 mm) |
| Silt | from 0.002 mm to 0.06 mm | Hydrometer sedimentation |
| Clay | smaller than 0.002 mm | Hydrometer sedimentation |
One detail in the table trips up many people: silt runs from 0.002 mm to 0.06 mm, not up to 0.6 mm. Some pages that feed search engine and AI answers swap 0.06 for 0.6, and the error is large: 0.6 mm is medium-to-coarse sand, a grain you can see with the naked eye. There is a second subtlety. The finest sieve in the set, 0.075 mm, does not match the sand/silt boundary of 0.06 mm. Only sedimentation resolves the range between the two values. In a test done by sieving alone, everything passing the 0.075 mm sieve is counted together as "fines".
In nature, almost no soil consists of a single fraction. The name follows the dominant fraction, with the secondary one as an adjective. A "clayey sand" is mostly sand, with enough clay to change its behavior, and a "sandy clay" is the opposite. The word order is technical, not a matter of style.
Particle size scales: ABNT, USCS and Embrapa
A particle size scale is the set of boundaries a system uses to separate the fractions, and each technical field has adopted its own. The boundary between sand and fines in particular changes from one system to another. Percentages of sand or silt calculated on different scales cannot be compared directly:
| Fraction | ABNT NBR 6502:2022 | USCS (ASTM D2487) | Agronomic texture (Embrapa, Brazil, 2017) |
|---|---|---|---|
| Clay | < 0.002 mm | Fines, < 0.075 mm; silt and clay are separated by plasticity, not by size | < 0.002 mm |
| Silt | 0.002 to 0.06 mm | Fines, < 0.075 mm | 0.002 mm up to the 0.053 mm sieve |
| Sand | 0.06 to 2.0 mm | 0.075 to 4.75 mm | 0.053 to 2.0 mm (coarse and fine separated at 0.212 mm) |
| Gravel | 2.0 to 60 mm | 4.75 to 75 mm | Above 2.0 mm, outside the fine earth analyzed |
The gravel boundary has the most practical consequences. For ABNT, a 3 mm grain is gravel. For the USCS, which separates gravel from sand at the No. 4 sieve (4.75 mm), it is still sand. The test report should therefore state which scale was used, and a USCS classification should use the USCS boundaries, as in the worked example further below.
The standard: ABNT NBR 7181:2025
ABNT NBR 7181:2025, Soil: Particle size analysis, is the Brazilian standard for the particle size analysis of soils, either by sieving alone or by combined sedimentation and sieving. The editions and status of the standards below were checked on October 7, 2026. NBR 7181 and NBR 6457 were checked in their full text, the other ABNT standards in their catalog entries, the DNIT standard in the PDF of the agency's collection (gov.br) and the ASTM standards in the ASTM store.
| Standard | Subject | Status checked on October 7, 2026 |
|---|---|---|
| ABNT NBR 7181:2025 | Soil: particle size analysis (sieving and sedimentation) | Current; 3rd edition, January 15, 2025, in corrected version 2 of July 13, 2026 |
| ABNT NBR 6457:2024 | Sample preparation for compaction and characterization tests; moisture content | Current; 3rd edition, January 9, 2024 |
| ABNT NBR 6502:2022 | Soils and rocks: terminology (fraction boundaries) | Current; 2022 edition, which replaced the 1995 edition |
| ABNT NBR 17212:2025 | Density of solids of the fraction passing the 2.0 mm sieve | Current, with an erratum of October 2025 (catalog entry) |
| DNIT 459/2025-ME | Soils: particle size analysis (highway method) | Current, with Erratum 1 incorporated; cancels DNER-ME 051/94 and 080/94 |
| ASTM D6913/D6913M-17(2025) | Particle size distribution of soils by sieve analysis | Active (reapproved in 2025) |
| ASTM D7928-21e1 | Particle size distribution of fines by hydrometer sedimentation | Active |
| ASTM D2487-17(2025) | Classification of soils for engineering purposes (USCS) | Active (reapproved in 2025) |
Edition, errata and what changed
NBR 7181:2025 is the 3rd edition of the standard, published on January 15, 2025 by the Special Study Committee on Soils (ABNT/CEE-221). It cancels and replaces NBR 7181:2016 in Corrected Version 2 of 2018, which it declares technically revised. After publication it received two errata, Erratum 1 of December 18, 2025 and Erratum 2 of July 13, 2026. Both are incorporated in corrected version 2 of July 13, 2026, which is the version in force today. A new test report that cites the 1984 or 2016 edition has an outdated reference.
The 2025 text does not list the changes from the 2016 edition. Two changes can be verified in the text itself. First, the density of soil solids needed for sedimentation is now determined by NBR 17212, on the fraction passing the 2.0 mm sieve. Second, normative Annex A requires two calibration curves of its own for each hydrometer. Claims that the new edition "now requires balance calibration" are not supported by the text. Balance calibration appears in a note as a recommendation, not as a requirement.
The scope has not changed. The test can be done by sieving alone, when the fines do not need to be split into silt and clay, or by combined sedimentation and sieving, when the curve must also cover the fine fraction. The normative references are NBR 6457 for sample preparation and moisture content, NBR 17212 for the density of solids, and NBR NM ISO 3310-1 and 3310-2, which specify woven wire cloth and perforated plate test sieves.
The highway standard: DNIT 459/2025-ME
On projects of DNIT (Brazil's National Department of Transport Infrastructure), particle size analysis of soils follows DNIT 459/2025-ME, which cancelled and replaced DNER-ME 051/94 and DNER-ME 080/94. The method is essentially the same but differs in some details. In the fine series, DNIT uses the 0.30 mm sieve where NBR uses the 0.25 mm sieve. The hydrometer is specified as model 151H, with a symmetrical bulb, calibrated at 20 °C and graduated from 0.995 to 1.050, the same scale range as in NBR. The DNIT standard also says the diameter can be obtained with Casagrande's graphical method, which NBR 7181:2025 mentions in a note. The CBR test and the layer specifications require particle size analysis by this standard, as shown in the article on the CBR test.
The ASTM standards
In the United States, particle size analysis of soils is split into two standards: ASTM D6913/D6913M-17(2025) for sieve analysis and ASTM D7928-21e1 for hydrometer sedimentation of fines. Soils are classified from the curve and the Atterberg limits with ASTM D2487-17(2025), the Unified Soil Classification System. Watch the numbering: ASTM D7181 is a triaxial test standard and is unrelated to NBR 7181.
Apparatus for particle size analysis
The apparatus for particle size analysis under NBR 7181:2025 has two parts. The sieving part includes sieves, sieve shaker, oven and balances. The sedimentation part includes dispersion apparatus, sedimentation cylinder, hydrometer and thermometer. The items below are described in our own words:
- Sieves: 13 openings of 50, 38, 25, 19, 9.5, 4.8, 2.0, 1.2, 0.6, 0.42, 0.25, 0.15 and 0.075 mm, conforming to NBR NM ISO 3310-1 and 3310-2, plus a wire brush to free grains stuck in the mesh;
- Mechanical sieve shaker: able to hold up to six sieves, counting the lid and the pan;
- Oven: able to hold 105 °C to 110 °C and also 60 °C to 65 °C;
- Balances: 200 g with 0.01 g resolution, 1.5 kg with 0.1 g, 5 kg with 0.5 g and 10 kg with 1 g;
- Dispersion apparatus: with a replaceable impeller turning at no less than 9,000 revolutions per minute inside a cup with fixed baffles, which break up the vortex and force the suspension to mix;
- Sedimentation cylinder: glass, about 450 mm high and 65 mm in diameter, with a 1,000 cm³ mark at 20 °C;
- Symmetrical-bulb hydrometer: calibrated at 20 °C, with a scale from 0.995 to 1.050;
- Thermometer: 0 °C to 50 °C, graduated in 0.1 °C, and a clock or timer that shows seconds;
- Constant-temperature bath: to keep the suspension at a roughly constant temperature; not needed when the room temperature itself is stable;
- Accessories: mortar and pestle, a beaker of at least 250 cm³, a 250 cm³ graduated cylinder, a glass stirring rod, a wash bottle, moisture cans and containers that keep the sample's moisture.
The balance for the initial weighing depends on the largest grain in the sample. Above 25 mm, use the 10 kg balance with 1 g resolution. From 5 mm to 25 mm, use the 5 kg balance with 0.5 g. Below 5 mm, use the 1.5 kg balance with 0.1 g. In the sieve stack, openings decrease from top to bottom, with the lid on top and the pan at the bottom, so that each grain stops on the first mesh it cannot pass.
How to perform the particle size analysis, step by step
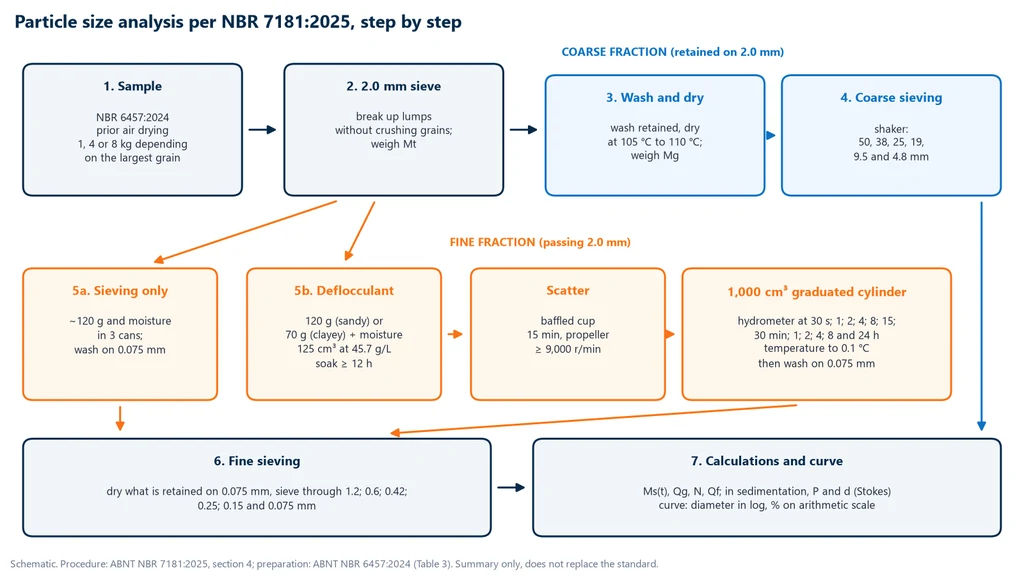
Particle size analysis under NBR 7181:2025 (the Brazilian standard for soil particle size analysis) splits the sample on the 2.0 mm sieve and handles the two parts differently. The retained material goes to coarse sieving. The passing material goes to fine sieving or to sedimentation. The flowchart below shows the full path, from the prepared sample to the curve:
Sample preparation according to NBR 6457:2024
The sample is prepared according to NBR 6457:2024 (the Brazilian standard for soil sample preparation). For particle size analysis, this standard always calls for the procedure with prior drying: the soil is air-dried, the clods are broken up without crushing the grains, and the sample is reduced with a sample splitter or by quartering. The minimum quantity depends on the largest grain, estimated visually: 1 kg if it is smaller than 5 mm, 4 kg if it is between 5 mm and 25 mm, and 8 kg if it is larger than 25 mm. For sedimentation, the same standard calls for about 500 g of the material passing the 2.0 mm sieve to determine the particle density of the solids. Full preparation and moisture content determination are covered in the article on NBR 6457.
Separation on the 2.0 mm sieve
The air-dried sample is weighed on the balance chosen for the largest grain, and this mass is Mt. It is then passed through the 2.0 mm sieve. Clods are broken up in a mortar so that only grains actually larger than the opening are retained. The retained material is washed to remove the fines stuck to it, then dried in an oven at 105 °C to 110 °C to constant mass. If the washing is skipped, clay adhering to the gravel gets counted as gravel.
Coarse sieving and fine sieving
The material retained on the 2.0 mm sieve, washed and dried, is weighed (Mg) and run in the sieve shaker through the 50, 38, 25, 19, 9.5 and 4.8 mm sieves, and the cumulative mass retained on each one is recorded. This is the coarse sieving.
When the test is by sieving only, about 120 g of the material passing the 2.0 mm sieve is taken and weighed to 0.01 g, along with about 100 g more for three hygroscopic moisture content determinations. The 120 g is washed on the 0.075 mm sieve with low-pressure potable water. The retained material is dried at 105 °C to 110 °C and passed through the 1.2, 0.6, 0.42, 0.25, 0.15 and 0.075 mm sieves, and the cumulative retained masses are recorded. This is the fine sieving. For very uniform soils, the standard allows intermediate sieves in both sievings, so the curve has enough points in the narrow range where the soil is concentrated.
Hydrometer sedimentation
When the curve has to separate silt from clay, the part passing the 2.0 mm sieve goes to sedimentation before fine sieving. The NBR 7181:2025 sequence is:
- Mass: about 120 g for sandy soils or 70 g for silty and clayey soils, weighed to 0.01 g, and about 100 g more for three hygroscopic moisture contents.
- Deflocculant: the soil is placed in a beaker with 125 cm³ of sodium hexametaphosphate solution at 45.7 g per liter, buffered with sodium carbonate to pH 8 to 9. The buffer keeps the hexametaphosphate from reverting to orthophosphate and losing its effect, and the standard requires the shelf life of the salts to be respected. If this deflocculant does not disperse the soil, another type or another dosage has to be investigated.
- Soaking: the beaker is stirred until all the material is immersed and left to stand for at least 12 hours.
- Dispersion: the mixture is transferred to the dispersion cup, topped up with distilled water to about 5 cm below the rim, and dispersed for 15 minutes. Soils whose grains break down during this process call for a shorter time, which the standard leaves to the laboratory.
- Cylinder: the suspension is transferred to the sedimentation cylinder, topped up to 1,000 cm³ and placed in a water bath or a constant-temperature room. Once thermal equilibrium is reached, the mouth is covered with the hand and the cylinder is turned upside down and back for 1 minute.
- Readings: timing starts the moment the cylinder is set back on the bench. The hydrometer is immersed and read at 30 s, 1 min and 2 min while it stays in the suspension, and then removed. The following readings are taken at 4, 8, 15 and 30 minutes and at 1, 2, 4, 8 and 24 hours, with the hydrometer inserted 15 to 20 seconds before each one, for 12 readings in all. The standard recommends repeating the first three after shaking the cylinder again.
- How to read: the reading is taken at the top of the meniscus once the hydrometer has settled, interpolated to 0.0005. Between readings, the hydrometer is kept in a cylinder of clean water at the same temperature. The suspension temperature is measured to 0.1 °C after each reading except the first two.
- End: after the 24-hour reading, the entire suspension is washed on the 0.075 mm sieve, and the retained material goes on to fine sieving, as in the sieving-only test.
There is a practical reason for reading at the top of the meniscus: the soil suspension is opaque, so the bottom of the meniscus cannot be seen. The correction for this effect, and the corrections for temperature and for the dissolved deflocculant, are already built into the hydrometer calibration.
Calibrating each hydrometer
Annex A of NBR 7181:2025 is normative and requires two curves for each hydrometer in the laboratory. The first relates the reading in the dispersing medium to temperature: 125 cm³ of the deflocculant solution is diluted in 875 cm³ of distilled water, and the hydrometer is read at the top of the meniscus at temperatures from 10 °C to 35 °C. This curve gives the reading Lmd used in the calculation. The second relates the reading to the fall height. The height a is the distance from each graduation on the stem to the center of volume of the bulb, and it applies to the readings in the first 2 minutes, while the hydrometer stays in the suspension. For the later readings, when the hydrometer is inserted and removed, the corrected height a' is used, which subtracts the rise in level caused by the bulb volume: a' = a − Va/(2A), where Va is the bulb volume and A is the inside area of the cylinder. Using one hydrometer's curve on another is a systematic error, even if both are the same model.
Stokes' law: why sedimentation takes 24 hours
Stokes' law states that a small sphere falling through a viscous liquid reaches a constant velocity proportional to the square of its diameter: v = (ρs − ρw) · g · d² / (18 · η), where ρs is the particle density of the grains, ρw the density of water, g the acceleration due to gravity and η the viscosity of water. Sedimentation uses this law in reverse. At each reading, the elapsed time and the fall height give the largest diameter still in suspension at the level of the hydrometer, and the reading tells how much soil is still there.
The NBR 7181:2025 form
NBR 7181:2025 writes the law already solved for diameter, in laboratory units: d = √[1,800 · μ / (ρs − ρmd) · z / t], with d in mm, μ the viscosity of the dispersing medium in g·s/cm², z the fall height in cm (a or a', from the hydrometer calibration), t the time in seconds and ρmd the density of the dispersing medium, which the standard sets at 1.000 g/cm³. The factor 1,800 converts the units. The viscosity comes from a table in the standard as a function of the measured temperature. At 20 °C it is 10.29 × 10⁻⁶ g·s/cm², and intermediate values are interpolated linearly. That is why the temperature has to be measured at each reading: the viscosity of water drops by about 2% per degree, and the settling velocity rises by the same proportion.
How long each grain takes to settle
The chart below shows the time a particle takes to fall 10 cm in water at 20 °C, for the diameters that mark fraction boundaries. These are Biopdi calculations with ρs = 2.65 g/cm³ and η = 1.002 × 10⁻³ Pa·s, not values from the standard. The marks at the top are the 12 readings of NBR 7181:2025:
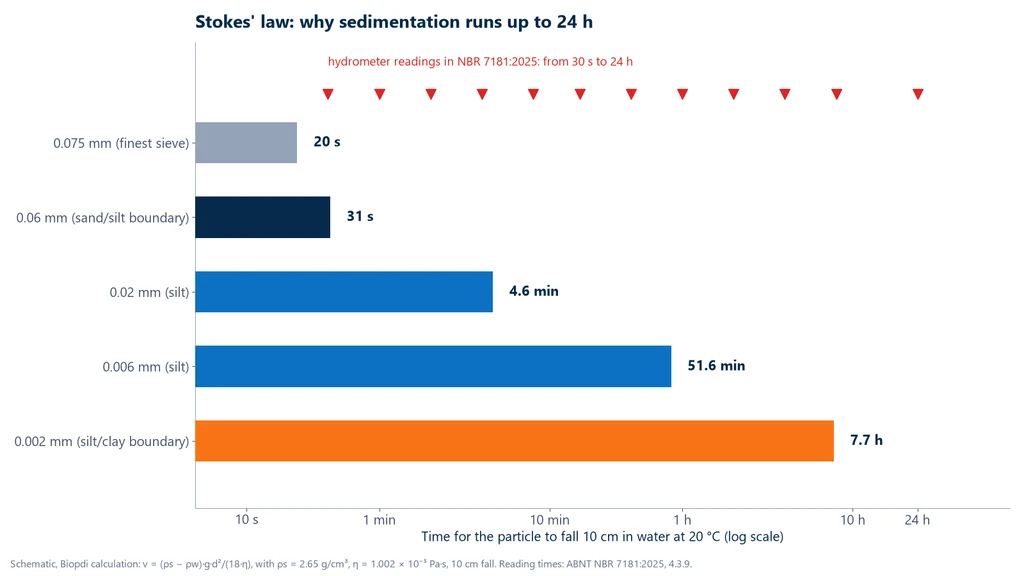
Here is the calculation for the 0.002 mm grain, step by step: v = (2,650 − 1,000) × 9.81 × (2 × 10⁻⁶)² / (18 × 1.002 × 10⁻³) = 3.59 × 10⁻⁶ m/s, or about 13 mm per hour. To fall 0.10 m, it takes 0.10 / 3.59 × 10⁻⁶ = 27,900 s, about 7.7 hours. The 0.06 mm grain is 30 times larger and falls 900 times faster, covering the same 10 cm in 31 s. The first reading, at 30 s, is close to the sand–silt boundary, and the 8-hour and 24-hour readings reach well into the clay fraction. The reading times grow in a roughly geometric progression, mostly doubling each time, because the diameter decreases with the square root of time. Doubling the time reduces the diameter read by about 30%, which spaces the points evenly on the logarithmic axis of the curve.
Assumptions and limitations
Stokes' law applies to a rigid, isolated sphere falling under laminar flow in a still liquid. In the cylinder, three of these assumptions are only approximations. Clay particles are plates, not spheres. The suspension contains many particles that interact with each other. And dispersion has to be complete, or clay aggregates will settle as if they were silt grains. For these reasons, the sedimentation diameter is an equivalent diameter, and the deflocculant and mechanical dispersion have a large effect on the result: a poorly dispersed clay shows up on the curve as silt, and the soil looks coarser than it really is.
NBR 7181:2025 calculations
The particle size analysis calculation turns the retained masses and the hydrometer readings into percentages passing, always relative to the total dry mass of the sample. There are five expressions, given here in the notation of the standard and in our own words:
- Total dry mass: Ms(t) = (Mt − Mg) / (1 + w) + Mg, in g. The hygroscopic moisture content w, as a decimal, is removed from the part passing the 2.0 mm sieve. The part retained on the 2.0 mm sieve has already been oven-dried and enters directly.
- Percentage passing the coarse sieves (50 to 2.0 mm): Qg = (Ms(t) − Mr) / Ms(t) × 100, where Mr is the cumulative mass retained on the sieve.
- Percentage passing the 2.0 mm sieve: N = (Ms(t) − Mr(2.0)) / Ms(t) × 100. This factor scales the fine-fraction percentages to the whole sample.
- Percentage passing the fine sieves (1.2 to 0.075 mm): Qf = [(Mu − Mr · (1 + w)) / Mu] × N, where Mu is the moist mass taken for fine sieving or sedimentation. The retained mass is weighed dry, so it is multiplied by (1 + w) to put it on the same moist basis as Mu.
- Percentage in suspension during sedimentation: P = [ (1 / Ms) · ρs / (ρs − ρmd) · (L − Lmd) · 1,000 ] × N. This applies to the 1,000 cm³ cylinder, with Ms the dry mass used for sedimentation, L the reading in the suspension and Lmd the reading in the dispersing medium at the same temperature. Each P is paired with the diameter d calculated from Stokes' law for the same moment.
The particle density of solids ρs, used in the percentage in suspension and in the diameter, comes from a separate test under NBR 17212 (the Brazilian standard for particle density of soil solids), run on the material passing the 2.0 mm sieve. Particle size analysis with sedimentation therefore depends on two tests.
Particle size distribution curve: how to plot and read it
The particle size distribution curve plots the percentage passing on an arithmetic vertical axis against grain diameter on a logarithmic horizontal axis, as NBR 7181:2025 requires. The standard also allows the percentage retained on the vertical axis, as long as the test report states which one was used. The logarithmic scale is mandatory for a simple reason: diameters range from about 50 mm to less than 0.001 mm, almost five orders of magnitude, and on a linear scale all the clay and silt would be squeezed against zero.
Logarithmic interpolation of D10, D30 and D60
The characteristic diameters D10, D30 and D60 are the diameters below which 10%, 30% and 60% of the soil mass passes. A sieve rarely falls exactly at these percentages, so the value is interpolated between the two neighboring sieves. Since the axis is logarithmic, the interpolation must be logarithmic too:
Dx = D1 · (D2 / D1)(x − P1) / (P2 − P1)
where D1 and D2 are the openings of the neighboring sieves and P1 and P2 are the percentages passing them. Linear interpolation between the openings gives a slightly larger diameter than the one read from the curve, and the error grows as the two sieves get farther apart. Reading the value by eye from a printed chart is fine as a check, but not for the test report.
Three curve shapes
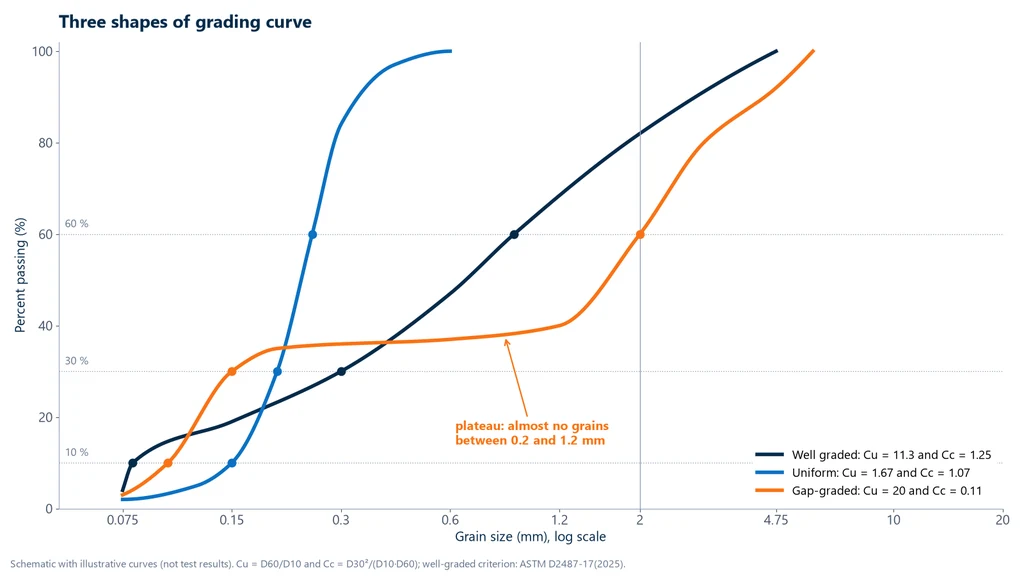
Before any calculation, the shape of the curve tells you how the soil is graded. A long, smooth curve spanning several fractions belongs to a well-graded soil, with grains of all sizes. An almost vertical curve belongs to a uniform soil, with nearly all grains the same size, like beach sand. A curve with a horizontal plateau belongs to a gap-graded soil, which is missing a range of sizes. The chart shows the three shapes using illustrative curves, not test results:
The fractions can also be read from the curve: the percentage of each fraction is the difference between the percentages passing at its two boundaries. If a soil's curve shows 68% passing at 0.06 mm and 42% at 0.002 mm, it has 42% clay and 68 − 42 = 26% silt.
D10, Cu and Cc: well-graded or poorly graded soil
The coefficient of uniformity, Cu, and the coefficient of curvature, Cc, are the two numbers that turn the shape of the curve into a classification criterion. Cu, also called the uniformity coefficient, is Cu = D60 / D10 and measures how far the curve extends: the larger it is, the wider the range of grain sizes. Cc is Cc = D30² / (D10 · D60) and measures the shape of the curve between D10 and D60: values between 1 and 3 indicate a curve with no missing intermediate sizes.
The most widely used criterion for deciding whether a coarse-grained soil is well graded is the USCS criterion in ASTM D2487-17(2025), which applies to gravels and sands with less than 5% fines:
| Coarse-grained soil | Well graded | Poorly graded |
|---|---|---|
| Gravel with less than 5% fines | Cu ≥ 4 and 1 ≤ Cc ≤ 3 (GW) | Any criterion not met (GP) |
| Sand with less than 5% fines | Cu ≥ 6 and 1 ≤ Cc ≤ 3 (SW) | Any criterion not met (SP) |
| 5% to 12% fines | Dual symbol, such as SW-SM or GW-GC | Dual symbol, such as SP-SM or SP-SC |
| More than 12% fines | GM, GC, SM or SC, depending on the plasticity of the fines (Atterberg limits) | |
In the USCS, "fines" are the material passing the 0.075 mm sieve, and the soil is a gravel or a sand depending on whether most of the coarse fraction is retained on or passes the 4.75 mm sieve. In the dual symbol, the second part (M or C) depends on whether the fines behave like silt or like clay, which is decided by the Atterberg limits, not by the curve.
The trap: a high Cu is not enough
A gap-graded soil can have a very high Cu, because D60 falls in the coarse range and D10 in the fine range, and still be poorly graded. In the illustrative gap-graded curve, Cu is 20, more than three times the minimum for sand, but Cc is 0.11: D30 sits right next to D10, because the intermediate range is missing. Without the intermediate grains, the fine grains do not fill the voids between the coarse ones, so the soil compacts poorly and can lose its fines through internal erosion. That is why a report that gives only Cu is incomplete, and the criterion always requires both coefficients.
Worked example, step by step
The following example runs through a sieve-only particle size analysis of a sand with a little gravel, from the masses to the classification. Then a hydrometer reading on another soil shows the calculation for the fine fraction. All the numbers were calculated by Biopdi with the equations of NBR 7181:2025 (the Brazilian standard for soil particle size analysis).
Step 1: total dry mass and percentage passing 2.0 mm
The largest grain in the sample is between 4.8 mm and 9.5 mm, so NBR 6457:2024 (the Brazilian standard for soil sample preparation) requires at least 4 kg, and the initial weighing is done on the 5 kg balance with 0.5 g resolution. The air-dried sample has Mt = 4,000.0 g. The material retained on the 2.0 mm sieve, washed and dried, has Mg = 313.0 g, and the hygroscopic moisture content of the passing fraction, the average of three determinations, is w = 2.5%.
- Total dry mass: Ms(t) = (4,000.0 − 313.0) / 1.025 + 313.0 = 3,597.1 + 313.0 = 3,910.1 g.
- Passing 2.0 mm: N = (3,910.1 − 313.0) / 3,910.1 × 100 = 92.0%.
- Coarse sieving: nothing was retained on the 9.5 mm sieve, and the cumulative mass retained on the 4.8 mm sieve was 78.0 g, so Qg = (3,910.1 − 78.0) / 3,910.1 × 100 = 98.0% at 4.8 mm.
Step 2: fine sieving
From the material passing 2.0 mm, Mu = 120.00 g of moist soil was taken, washed over the 0.075 mm sieve, dried and sieved. For each sieve, the cumulative retained mass is multiplied by 1.025 and goes into Qf. On the 1.2 mm sieve, for example, the cumulative retained mass was 11.45 g, and Qf = [(120.00 − 11.45 × 1.025) / 120.00] × 92.0 = (108.26 / 120.00) × 92.0 = 83.0%. The other sieves follow the same calculation:
| Sieve (mm) | Cumulative retained (g) | Retained × 1.025 (g) | Passing (%) |
|---|---|---|---|
| 9.5 | 0.0 | (coarse sieving) | 100.0 |
| 4.8 | 78.0 | (coarse sieving) | 98.0 |
| 2.0 | 313.0 | (coarse sieving) | 92.0 |
| 1.2 | 11.45 | 11.74 | 83.0 |
| 0.6 | 28.00 | 28.70 | 70.0 |
| 0.42 | 43.27 | 44.35 | 58.0 |
| 0.25 | 61.08 | 62.61 | 44.0 |
| 0.15 | 85.26 | 87.39 | 25.0 |
| 0.075 | 106.89 | 109.56 | 8.0 |
Step 3: D10, D30 and D60
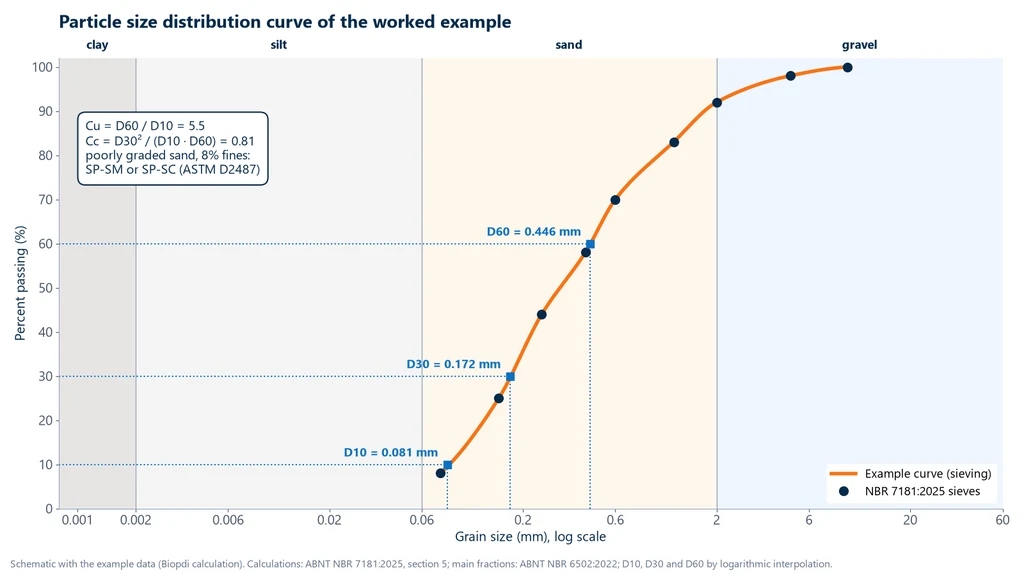
Using logarithmic interpolation between adjacent sieves:
- D10, between 0.075 mm (8.0%) and 0.15 mm (25.0%): D10 = 0.075 × 22/17 = 0.075 × 1.085 = 0.081 mm.
- D30, between 0.15 mm (25.0%) and 0.25 mm (44.0%): D30 = 0.15 × 1.6675/19 = 0.15 × 1.144 = 0.172 mm.
- D60, between 0.42 mm (58.0%) and 0.6 mm (70.0%): D60 = 0.42 × 1.4292/12 = 0.42 × 1.061 = 0.446 mm.
With the unrounded diameters (0.0814, 0.1716 and 0.4457 mm), the coefficients are Cu = 0.4457 / 0.0814 = 5.5 and Cc = 0.1716² / (0.0814 × 0.4457) = 0.02945 / 0.03628 = 0.81. The graph shows the example curve over the NBR 6502:2022 size ranges, with the three diameters marked:
Step 4: fractions and classification
On the NBR 6502:2022 scale (the Brazilian standard for soil and rock terminology), the soil has 100 − 92.0 = 8.0% gravel (above 2.0 mm) and 92.0 − 8.0 = 84.0% of grains between 0.075 and 2.0 mm, almost all of it sand. The 8.0% passing 0.075 mm is fines: since the analysis was by sieving only, these are not separated into silt and clay, and they include the small band of very fine sand between 0.06 and 0.075 mm.
For the USCS, the boundaries are different. 98.0% passes the 4.75 mm sieve (the 4.8 mm sieve in the Brazilian series), so only 2.0% of the mass is gravel, and the coarse fraction is almost all sand: the soil is a sand. The fines content is 8.0%, between 5% and 12%, which requires a dual symbol. The Cu of 5.5 does not reach 6, and the Cc of 0.81 is below 1: the sand is poorly graded (SP), even with a curve that, by eye, looks reasonably spread out. The final classification is SP-SM if the fines behave like silt, or SP-SC if they behave like clay, which is decided by the Atterberg limits of the fines.
Step 5: a hydrometer reading
For another, finer soil, the hydrometer (sedimentation) analysis was done with Mu = 70.00 g of moist soil at a hygroscopic moisture content of 2.0%, which gives Ms = 70.00 / 1.020 = 68.63 g dry. The percentage of this soil passing 2.0 mm is N = 96.0%, and the particle density, determined by NBR 17212 (the Brazilian standard for soil particle density), is ρs = 2.70 g/cm³. At the 1-hour reading, at 20 °C, the hydrometer read L = 1.0250, and the calibration curve gave Lmd = 1.0050 for the dispersing solution at that temperature.
- Percentage in suspension: P = [(1 / 68.63) × 2.70 / (2.70 − 1.000) × (1.0250 − 1.0050) × 1,000] × 96.0 = (0.014571 × 1.588 × 20.0) × 96.0 = 44.4%.
- Diameter: with μ = 10.29 × 10⁻⁶ g·s/cm² (20 °C), t = 3,600 s and a fall height of z = 17.5 cm, a value adopted for this example that, in a real test, comes from the a' curve of the hydrometer used: d = √[1,800 × 10.29 × 10⁻⁶ / 1.70 × 17.5 / 3,600] = √(5.30 × 10⁻⁵) = 0.0073 mm.
The reading shows that 44.4% of the total mass of this soil is finer than 0.0073 mm, a diameter within the silt fraction. The other eleven readings give the remaining points of the fine part of the curve, which joins the sieved part at the 0.075 mm diameter.
Soil, aggregate and agronomic texture: three kinds of particle size analysis
The word granulometry (particle size analysis) names three different tests, each with its own standards, methods and purposes. In geotechnical engineering, it is the continuous curve of NBR 7181:2025; in concrete, it is the grading of aggregates; in agronomy, it is the texture analysis that feeds crop management. The table summarizes the differences:
| Aspect | Soil for engineering | Aggregate for concrete | Agronomic texture |
|---|---|---|---|
| Reference | ABNT NBR 7181:2025 | ABNT NBR 17054 | Manual de Métodos de Análise de Solo, Embrapa (2017), ch. 10 |
| Method | Sieving and hydrometer sedimentation | Sieving only | Chemical and mechanical dispersion; hydrometer or pipette |
| Result | Continuous curve, D10, Cu and Cc | Curve, fineness modulus and maximum characteristic size | Sand, silt and clay contents in g/kg and textural class |
| Sand/silt boundary | 0.06 mm (NBR 6502:2022) | Does not separate silt and clay | 0.053 mm sieve |
The fineness modulus, which comes up often in searches about the particle size distribution curve, is an aggregate index: the sum of the cumulative percentages retained on the sieves of the standard series, divided by 100. It is not calculated for soil. In agronomy, the Embrapa method (Embrapa is the Brazilian Agricultural Research Corporation) works with air-dried fine earth (the fraction passing 2.0 mm), disperses the sample with sodium hydroxide or another dispersant and mechanical stirring, separates the sand on the 0.053 mm sieve, divides coarse and fine sand on the 0.212 mm sieve and measures silt and clay by pipette or by a hydrometer graduated in g/L. Anyone looking for texture analysis for crops will find the full procedure in the particle size analysis chapter of the Embrapa Manual (in Portuguese). From here on, the subject is engineering soil again.
Common mistakes in particle size analysis
Most incorrect particle size distribution curves come from incomplete dispersion, grain breakage or a mixed-up reference, not from the calculation. The mistakes below are the most frequent ones in test reports and technical web pages:
- Citing the 1984 or 2016 edition of NBR 7181 as current. The edition in force is the 2025 edition, in corrected version 2, of July 13, 2026.
- Writing that silt goes up to 0.6 mm. Silt goes up to 0.06 mm; 0.6 mm is sand.
- Mixing scales. ABNT sets the sand/silt boundary at 0.06 mm, the USCS separates fines at 0.075 mm and Embrapa separates sand at 0.053 mm. Percentages from different scales cannot be compared.
- Using an expired or unbuffered deflocculant. Sodium hexametaphosphate solution loses its effect over time and outside pH 8 to 9; the clay flocculates, settles as silt, and the curve underestimates the clay.
- Crushing grains in the mortar. Disaggregation should break up lumps, not grind grains; broken grains create fines the soil did not have.
- Not washing the material retained on 2.0 mm. Fines stuck to the gravel particles end up in the wrong fraction.
- Reading the hydrometer at the bottom of the meniscus or before it settles. The reading is taken at the top of the meniscus, interpolating to 0.0005.
- Not measuring the temperature. Viscosity and the reading in the dispersing solution change with it, and the error in P and d is systematic.
- Using the calibration of another hydrometer. The two curves in Annex A belong to each individual hydrometer.
- Interpolating D10, D30 and D60 linearly. The axis is logarithmic, and so must the interpolation be.
- Reporting Cu without Cc. A gap-graded curve has a high Cu and is poorly graded.
- Classifying fine-grained soil by the curve alone. With more than half passing 0.075 mm, the Atterberg limits are what decide.
- Testing with less than the minimum mass. A few coarse grains in a small sample distort the gravel percentage; NBR 6457:2024 sets 1, 4 or 8 kg depending on the largest grain.
After particle size analysis: the next soil tests
Particle size analysis tells you what the soil is made of; mechanical tests tell you how it behaves under load. That is why it opens the characterization sequence, and almost every soil test for construction comes after it.
The immediate next step, for soils with fines, is the Atterberg limits, which complete the classification. For embankments and pavement layers comes Proctor compaction, whose mold is chosen based on the material retained on the 4.8 mm and 19.1 mm sieves, and then the CBR test, which measures the bearing capacity of the compacted soil. The shear strength of embankments, slopes and foundations is measured in the direct shear test and the triaxial test, and the settlement of saturated fine-grained soils in the consolidation test. Particle size analysis also guides these choices: a clean sand goes to the direct shear test or the drained triaxial test, while a soft clay calls for consolidation and undrained triaxial testing.
The Biopdi CBR test press
Biopdi manufactures the CBR/Marshall test press, which receives the compacted specimen and performs the penetration of the CBR test, the test that depends most on particle size distribution in pavement specifications. It is a 50 kN (11,240 lbf) press, available in two models, manual and automatic electric; in the automatic electric version, speed control ranges from 0.001 to 50 mm/min, which includes the 1.27 mm/min of CBR penetration. Biopdi does not manufacture the sieves, sieve shaker, dispersion apparatus, hydrometer or balance used in particle size analysis: the link between the tests is the characterized soil. The panel below shows the press and what each part does in the test:
The CBR/Marshall test press after soil characterization
Once particle size analysis and compaction are done, the specimen molded in the large mold goes to the 50 kN (11,240 lbf) press. Each part has a function in CBR penetration:
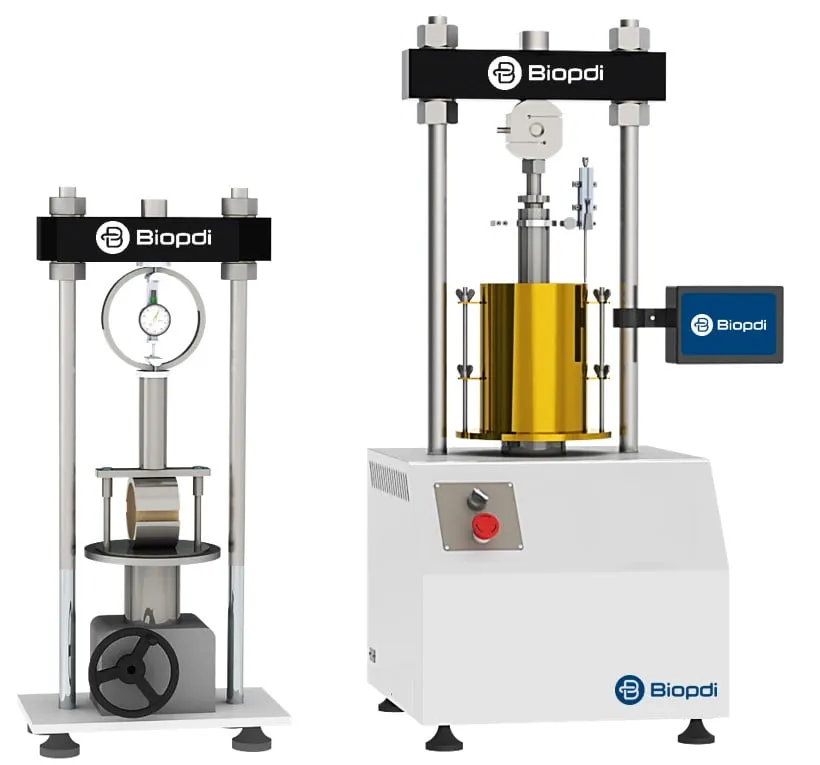
- Two models manual and automatic electric, both with CBR and Marshall fixtures
- Speed control from 0.001 to 50 mm/min in the automatic version, which includes the 1.27 mm/min of the CBR test
- Interchangeable load cell from 5 to 5,000 kgf (0.05 to 49 kN)
- 50 mm LVDT with 0.01 mm resolution, for penetration
- 100 mm stroke with automatic return at the end of the test
The other equipment in the line, such as the consolidation, direct shear and triaxial systems, is listed under soil testing equipment.
Conclusion
Soil particle size distribution is the distribution of grain sizes, measured according to NBR 7181:2025 in two parts: sieves for grains larger than 0.075 mm and hydrometer sedimentation, governed by Stokes' law, for the fines. The curve on a logarithmic scale gives the NBR 6502:2022 fractions, the diameters D10, D30 and D60 and the coefficients Cu and Cc, which tell whether a coarse-grained soil is well or poorly graded; for fine-grained soils, the Atterberg limits have the final say. An in-date deflocculant, complete dispersion, reading at the top of the meniscus, measured temperature and a calibrated hydrometer are what separate a reliable curve from one that makes clay look like silt.
The tests that follow characterization have their own articles: Proctor compaction, the CBR test, the triaxial test and the consolidation test. To choose the equipment for your laboratory's mechanical soil tests, talk to one of our specialists.
Other tests and technical references
Soil compaction and the Proctor test per ABNT NBR 7182:2025
Soil compaction on site and the Proctor test per NBR 7182:2025: compaction energies, worked curve example, optimum moisture content and degree of compaction.
CBR test and the California Bearing Ratio
CBR test (California Bearing Ratio): NBR 9895:2025 and DNIT 172 standards, procedure, formula with 6.9 and 10.35 MPa, worked example and CBR by layer.
Marshall test: stability, flow, Vv, VMA (VAM) and VFA (RBV) per DNIT 447/2024-ME
The Marshall test measures the stability and flow of asphalt mixtures at 60 °C per DNIT 447/2024-ME. Procedure, Vv, VMA, VFA and a worked example.
Direct shear test: ASTM D3080 standard, step-by-step procedure and how to calculate c' and φ'
The direct shear test measures soil shear strength and gives the cohesion c' and friction angle φ'. ASTM D3080-23, step by step, with a worked example.
Frequently asked questions
What is soil particle size distribution?
It is the distribution, by mass, of the grain sizes in a soil, expressed as the grain size distribution curve. In Brazil, it is determined by ABNT NBR 7181:2025 (the Brazilian standard for soil particle size analysis), by sieving for grains larger than 0.075 mm and by hydrometer sedimentation for silt and clay.
What are the types of particle size analysis?
There are two methods that are combined: sieving, for gravel and sand, and sedimentation, for silt and clay. NBR 7181:2025 allows the test by sieving alone or by a combination of sedimentation and sieving; in agronomy, sedimentation can be performed with a hydrometer or a pipette.
How does ABNT classify soil particle size?
Through ABNT NBR 6502:2022 (the Brazilian standard for soil and rock terminology), which defines the fractions: clay below 0.002 mm, silt from 0.002 to 0.06 mm, sand from 0.06 to 2.0 mm and gravel from 2.0 to 60 mm. The test that measures these fractions is ABNT NBR 7181:2025, which does not classify the soil, it only provides the curve.
What are the 4 soil types by particle size?
Gravel, sand, silt and clay, the four main fractions in NBR 6502:2022. Almost every soil is a mixture of them, and the name follows the predominant fraction, with the secondary one as an adjective, as in "clayey sand".
Which sieves are used in the particle size analysis?
NBR 7181:2025 uses 13 sieves: 50, 38, 25, 19, 9.5 and 4.8 mm for coarse sieving, the 2.0 mm sieve that separates the two parts, and 1.2, 0.6, 0.42, 0.25, 0.15 and 0.075 mm for fine sieving. DNIT 459/2025-ME (a test method of DNIT, Brazil's federal highway agency) uses the 0.30 mm sieve instead of the 0.25 mm sieve.
What is the grain size distribution curve used for?
It is used to read the soil fractions and the diameters D10, D30 and D60, calculate the coefficients Cu and Cc and classify the soil as well graded or poorly graded. It also guides the choice of mold in compaction, the assessment of drainage and filters and the acceptance of base and subbase materials.
How do you calculate the coefficient of uniformity and the coefficient of curvature?
Cu = D60 / D10 and Cc = D30² / (D10 · D60), with the diameters read from the curve by logarithmic interpolation. Under ASTM D2487-17(2025), a sand with less than 5% fines is well graded with Cu ≥ 6 and 1 ≤ Cc ≤ 3, and a gravel with Cu ≥ 4 and 1 ≤ Cc ≤ 3.
What is the particle size of sand?
Under NBR 6502:2022, sand is the fraction from 0.06 mm to 2.0 mm. In the USCS, sand ranges from 0.075 mm to 4.75 mm, and in the agronomic texture classification of Embrapa (the Brazilian Agricultural Research Corporation) it is separated on the 0.053 mm sieve; for concrete aggregate, the classification follows a different standard.
What is the difference between soil and aggregate particle size analysis?
Analysis of concrete aggregate, under NBR 17054 (the Brazilian standard for aggregate grading), uses sieving only and provides the fineness modulus and the maximum characteristic size. Soil analysis, under NBR 7181:2025, includes sedimentation for the fines and produces the curve down to the clay fraction; the fineness modulus is not calculated for soil.
Why does the sedimentation test take 24 hours?
Because fine grains settle very slowly: according to Stokes' law, a 0.002 mm grain takes about 7.7 hours to fall 10 cm in water at 20 °C, by Biopdi's calculation. The NBR 7181:2025 readings range from 30 seconds, which capture the sand/silt boundary, to 24 hours, which reach the clay.
Which standard replaced NBR 7181:2016?
ABNT NBR 7181:2025, 3rd edition, of January 15, 2025, which canceled NBR 7181:2016 Corrected Version 2:2018. It received Errata 1 and 2, incorporated into corrected version 2, of July 13, 2026.
What should a particle size analysis report include?
The report states the standard and edition followed, the masses and percentages passing each sieve, the hydrometer readings with time, temperature, diameter and percentage, the specific gravity of solids used and the grain size distribution curve with the diameter on a logarithmic scale. When classification is requested, it also includes the fractions, D10, D30, D60, Cu, Cc and the scale adopted.