
The Atterberg limits are the moisture contents at which a fine-grained soil changes from one consistency state to another. The liquid limit (LL), according to ABNT NBR 6459:2025 (the Brazilian standard for the liquid limit), is the moisture content at which the groove cut in the cup of the Casagrande apparatus closes after 25 blows. The plastic limit (PL), according to NBR 7180:2025, is the moisture content at which a thread of soil crumbles at a diameter of 3 mm. The plasticity index is PI = LL − PL. For example, a soil with an LL of 43% and a PL of 25% has a PI of 18% and classifies as CL, a low-plasticity (lean) clay.
This guide covers what the limits mean, the standards with their current editions checked on October 7, 2026, the step-by-step procedure for both tests, how to plot the liquid limit flow curve, the DNER one-point formula (DNER is Brazil's former federal highway department), the indices derived from the limits, the Casagrande plasticity chart, and the USCS and HRB (AASHTO) classifications. It all comes together in a worked example, from the first blow to the classification of the soil, followed by the mistakes that show up most often in test reports and course notes.
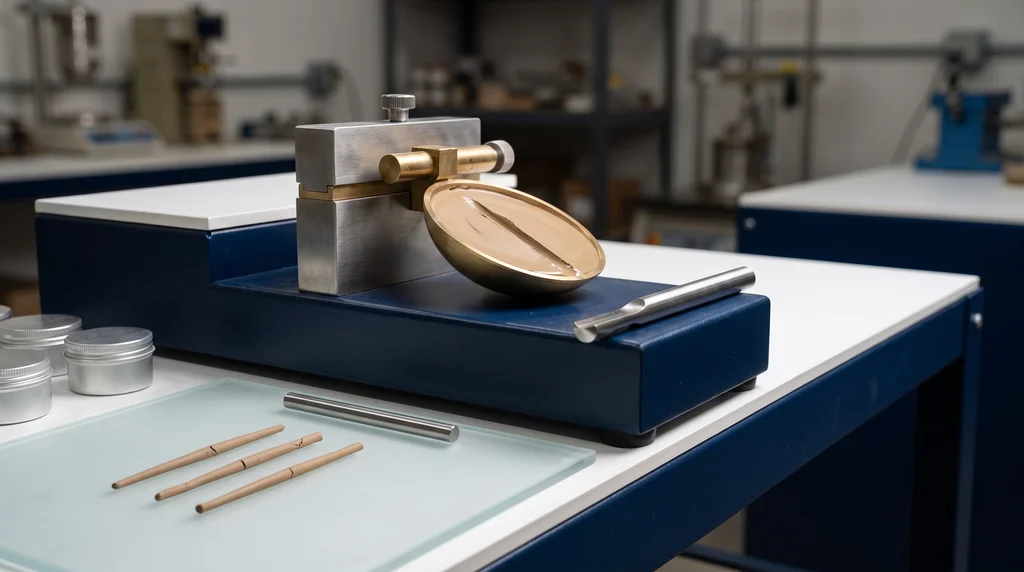
The photo shows both tests side by side on the bench: in the background, the brass cup of the Casagrande apparatus with the soil paste and the groove cut by the grooving tool; in the foreground, on the glass plate, the soil threads about 3 mm in diameter with the transverse cracks that indicate the plastic limit, next to the metal comparison gauge.
What the Atterberg limits are
The Atterberg limits, also called consistency limits, are the boundary moisture contents between the liquid, plastic, semisolid and solid states of a fine-grained soil. They do not measure a mechanical property directly: they measure how much water the fine fraction of the soil needs to change its behavior, and that amount depends on how much clay the soil contains and what type of clay it is.
The DNIT Paving Manual (Manual de Pavimentação, 3rd edition, 2006, pp. 35 and 36), published by Brazil's federal transportation infrastructure agency, sums up the logic: the plasticity index is a function of the amount of clay in the soil, while the liquid limit and the plastic limit depend on the amount and the type of clay. That is why two soils with the same clay percentage can have very different limits: a kaolinite clay and a montmorillonite clay hold water in different ways. It is also why the limits are always determined on the fine fraction, the material passing the 0.42 mm (No. 40) sieve: sand and gravel have no plasticity and would only dilute the result.
The four consistency states
Picture a saturated clay that is drying out. With a lot of water, it behaves like a dense fluid and flows under its own weight: this is the liquid state. As the water evaporates, it stiffens and can be molded without cracking and without flowing: this is the plastic state. Drying further, it loses the ability to be molded and crumbles when worked, although it still shrinks as it loses water: this is the semisolid state. Finally, below a certain moisture content the volume stops decreasing even though water keeps leaving: this is the solid state. The table summarizes the states and the limits that separate them:
| State | Moisture content range | Behavior |
|---|---|---|
| Liquid | w > LL | Flows like a dense fluid; very low shear strength |
| Plastic | PL < w < LL | Can be molded without cracking and without flowing |
| Semisolid | SL < w < PL | Crumbles when molded; still shrinks on drying |
| Solid | w < SL | Volume no longer decreases with drying |
The three limits are therefore the liquid limit (LL or wL), between the liquid and plastic states; the plastic limit (PL or wP), between the plastic and semisolid states; and the shrinkage limit (SL), between the semisolid and solid states. The distance between the LL and the PL is the range in which the soil is plastic, and that width is the plasticity index. The diagram below places the states on a line of increasing moisture content, with the PL and LL from the worked example in this article:
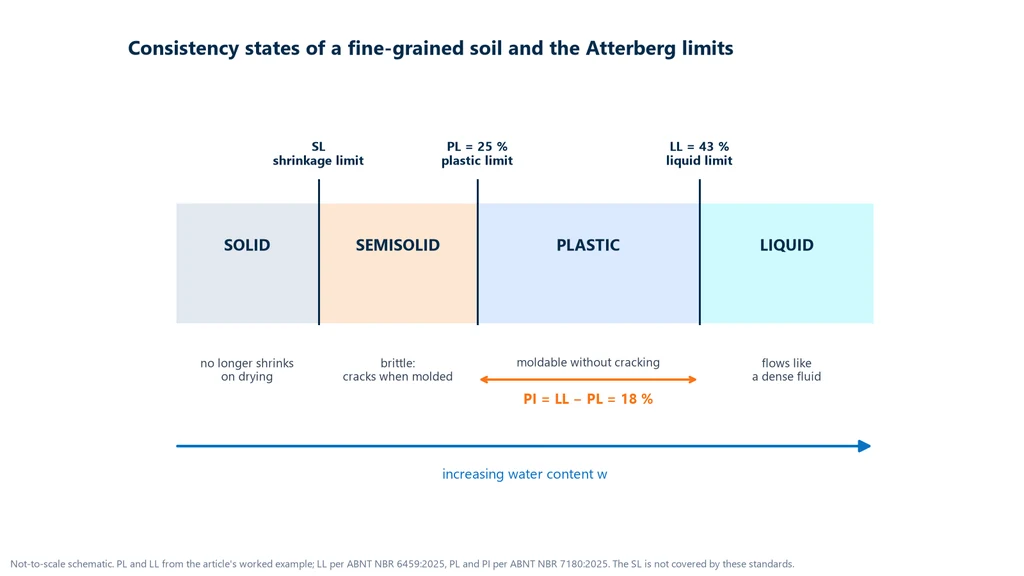
A word of caution when reading this: the PL is the boundary between the plastic and semisolid states. Saying the soil "goes from semisolid to plastic" at the PL is correct when water is added, and saying it "goes from plastic to semisolid" is correct when it dries. What does not change is the position: the PL is always the lower moisture content and the LL, the higher one.
From Atterberg to Casagrande
The limits were proposed in 1911 by the Swedish chemist and agronomist Albert Atterberg, using manual tests that were not yet standardized for engineering. The person who turned them into an engineering test was Arthur Casagrande. In "Research on the Atterberg Limits of Soils" (Public Roads, vol. 13, 1932), he proposed the cup apparatus with a standardized drop that bears his name and defined the liquid limit by the number of blows. In "Classification and Identification of Soils" (Transactions of the ASCE, vol. 113, 1948), he used the LL and the PI to classify fine-grained soils on a chart, the plasticity chart, which is the basis of the Unified Soil Classification System (USCS) still in use today.
Shrinkage limit
The shrinkage limit is the moisture content below which loss of water no longer reduces the volume of the soil. It completes the consistency scale, but it is not covered by NBR 6459 or NBR 7180, and it rarely appears in project specifications. In practice, when a soil characterization report refers to the "Atterberg limits," it means the LL, the PL and the PI calculated from them.
Standards for the limits: NBR 6459:2025, NBR 7180:2025, NBR 6457:2024, DNER and ASTM
In Brazil, the liquid limit is determined according to ABNT NBR 6459:2025 and the plastic limit, together with the calculation of the plasticity index, according to ABNT NBR 7180:2025; the sample is prepared and the moisture content is measured according to ABNT NBR 6457:2024. The editions below were checked on October 7, 2026: the ABNT standards in their full text, the DNIT standards in the agency's collection of standards (gov.br), and the foreign standards on the ASTM and ISO websites.
| Standard | Scope | Status checked on October 7, 2026 |
|---|---|---|
| ABNT NBR 6459:2025 | Soils: determination of the liquid limit (Casagrande apparatus) | Current; 3rd edition, of September 18, 2025, supersedes the 2016 edition |
| ABNT NBR 7180:2025 | Soils: determination of the plastic limit and calculation of the PI | Current; 3rd edition, of September 18, 2025, supersedes the 2016 edition |
| ABNT NBR 6457:2024 | Sample preparation and determination of moisture content | Current; 3rd edition, of January 9, 2024 |
| DNER-ME 122/94 | Liquid limit: reference method and rapid (one-point) method | In the DNIT collection of standards |
| DNER-ME 082/94 | Plastic limit | In the DNIT collection of standards |
| ASTM D4318-26 | LL (multipoint and one-point), PL and PI | Active |
| ISO 17892-12:2018 | LL (fall cone or Casagrande) and PL | Published and confirmed |
ABNT NBR 6459:2025 and NBR 7180:2025
The two Brazilian standards were published on the same day, September 18, 2025, as 3rd editions, by the Special Study Committee on Soils (ABNT/CEE-221). Each one cancels and replaces its 2016 edition, which is declared technically revised. The division of work between them is clear: NBR 6459:2025 deals only with the liquid limit, using the Casagrande apparatus; NBR 7180:2025 deals with the plastic limit, and it is the one that contains the PI calculation. Anyone looking for "the plasticity index standard" is looking for NBR 7180.
Neither text lists what changed relative to 2016. Claims that the 2025 edition "now requires" this or that need another source. What can be said with certainty is that a new test report citing NBR 6459:2016 or NBR 7180:2016 has an outdated reference, and that NBR 6459:2025 includes neither the fall cone method nor a one-point formula: it is the flow curve with at least five points.
ABNT NBR 6457:2024: preparation and moisture content
NBR 6457:2024 does not determine any limit: it prepares the sample and defines how to measure the moisture content. For the limits, about 200 g of material passing the 0.42 mm sieve is set aside. Preparation can be with prior air drying or without prior drying, and the latter is only allowed when no more than 10% of the sample is retained on the 0.42 mm sieve. Half of the sample goes to the LL and the other half to the PL. The moisture content of each container is measured in an oven at 105 °C to 110 °C to constant mass, with at least 8.0 g of moist soil per container for the LL and 1.5 g for the PL. The details of sample preparation and moisture content calculation are in the guide to NBR 6457: sample preparation and moisture content.
DNER highway standards
On highway projects in Brazil, the methods of the former DNER, found in the DNIT collection of standards, are still in use: DNER-ME 122/94, for the liquid limit, and DNER-ME 082/94, for the plastic limit. The principles are the same as in the ABNT standards, with differences in detail. DNER-ME 122/94 works with about 70 g of material and requires at least one point in each of the ranges of 25 to 35, 20 to 30 and 15 to 25 blows; it plots the curve with the axes swapped relative to the NBR, with the blows on a logarithmic scale on the ordinate and the moisture content on the abscissa; and it includes a rapid one-point method with a formula. The DNIT Paving Manual (2006) describes DNER-ME 082/94 with about 50 g of material and the same criterion of three values that do not deviate more than 5% from the mean.
ASTM D4318 and ISO 17892-12
In the United States, all three tests are in a single standard, ASTM D4318, currently in the D4318-26 edition. It has two methods for the LL, Method A (multipoint, the default when nothing is specified) and Method B (one-point), and two rolling procedures for the PL: by hand or with a rolling device. The standard had an unusual path in 2026: the previous edition was automatically withdrawn for passing its revision deadline and went to a reinstatement ballot, according to a note from ASTM itself dated July 22, 2026; D4318-26 is the active edition in the ASTM store. In the ISO system, the equivalent standard is ISO 17892-12:2018, which allows both the fall cone and the Casagrande apparatus for the LL.
Liquid limit: the Casagrande cup test (NBR 6459:2025)
The liquid limit is the moisture content at which a soil passes from the plastic to the liquid state. It is measured as the moisture content at which a groove cut in a soil paste, inside the cup of the Casagrande apparatus, closes after 25 blows. Hitting exactly 25 blows is hard, so NBR 6459:2025 (the Brazilian standard for liquid limit determination) requires testing at least five moisture contents and interpolating the value on a graph.
What the liquid limit means
Physically, the LL is the moisture content at which the soil's shear strength is so low that it flows under a standardized effort: the blows of the cup against the base make the two halves of the paste slide and join at the bottom of the groove. A high LL means the soil needs a lot of water to reach this state, which points to a large amount of clay, or to a type of clay that holds a lot of water. The Pavement Manual of DNIT (Brazil's National Department of Transport Infrastructure; Manual de Pavimentação, 2006, p. 36) states the practical consequence: the higher the LL, the more compressible the soil.
Apparatus and apparatus check
The liquid limit apparatus is simple, but NBR 6459:2025 requires the device to be checked before use, because the energy of each blow depends on the drop height, the mass of the cup and the hardness of the base. The items are:
- Casagrande apparatus, manual or motorized, with or without a blow counter: a brass cup attached to a cam that lifts it and drops it onto a hard rubber (ebonite) base at each turn of the crank.
- Grooving tool of standard dimensions, which cuts a V-shaped groove of fixed dimensions in the paste.
- Height gauge to set the drop height of the cup, and an 8 mm steel ball to check the base.
- Balance with 200 g capacity and 0.01 g resolution, oven capable of holding 60 °C to 65 °C and 105 °C to 110 °C, porcelain dish of about 120 mm, flexible spatula and containers that prevent moisture loss.
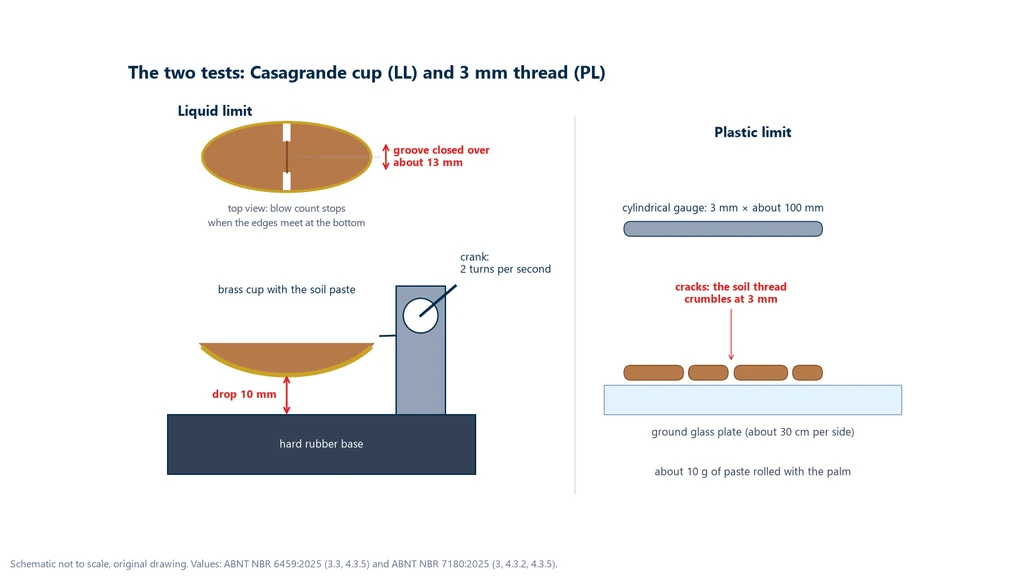
Under NBR 6459:2025, the apparatus check covers four things. The drop height: with the cup at its highest point, the point of contact with the base must be 10 mm above it, set with the gauge and rechecked after tightening the screws. The mass of the cup and cam follower assembly: (200 ± 20) g. The base: the 8 mm steel ball, released in free fall from 250 mm, must rebound between 185 mm and 230 mm, which proves the base is neither too soft nor too hard. And wear: pin without play, contact points without wear and a cup with no grooves that can be felt by touch. The standard does not set how often this check must be done; that is left to the laboratory's quality system.
The diagram below summarizes the dimensions that matter in both tests: on the left, the cup raised 10 mm above the base and, in top view, the groove closing at the bottom over about 13 mm; on the right, the plastic limit thread, which crumbles at 3 mm diameter, next to the comparison rod:
Liquid limit test, step by step
The test is preferably run in a climate-controlled room to reduce evaporation, using half of the sample prepared according to NBR 6457:2024 (the Brazilian standard for soil sample preparation). For a sample with prior drying, the NBR 6459:2025 sequence is:
- Prepare the paste: in the porcelain dish, add distilled water gradually, kneading and mixing with the spatula, until the consistency requires about 35 blows to close the groove. Mixing takes 15 to 30 minutes, the longer time for more clayey soils.
- Place it in the cup: holding the cup in your hand, spread part of the paste about 10 mm thick in the central part, with no air bubbles, and return the excess to the dish.
- Cut the groove: still holding the cup in your hand, divide the paste in half with the grooving tool, perpendicular to the cup surface and normally in the direction of the hinge. If the groove does not open in one stroke, make successive careful passes.
- Apply the blows: put the cup back on the apparatus and turn the crank at two turns per second, counting the blows until the lower edges of the groove meet over about 13 mm.
- Take the moisture content: immediately remove the soil next to the edges that closed and determine the moisture content according to NBR 6457:2024.
- Clean and repeat: return the rest of the paste to the dish, wash and dry the cup and the grooving tool, add water, mix for at least 3 minutes and repeat the cycle.
- Complete the points: continue until you have at least five points, from the driest, near 35 blows, to the wettest, near 15 blows.
Two details of this procedure separate a well-run test from one that only looks right. The first is the direction: the moisture content only goes up during the test, from dry to wet, because adding water is easy and uniform, while drying the paste with the spatula between points leaves the moisture uneven. The second is holding the cup in your hand while placing the paste and cutting the groove: with the cup mounted on the apparatus, the pressure of the grooving tool forces the cam and the hinge, and the apparatus loses the calibration that was just checked.
When the sample is tested without prior drying, NBR 6459:2025 starts from the natural moisture content: if it is lower than that of the first point, the procedure is the same; if it is enough for the first point, the sample is only mixed and the test continues from there. The report always states which of the two procedures was used.
How the liquid limit graph is plotted
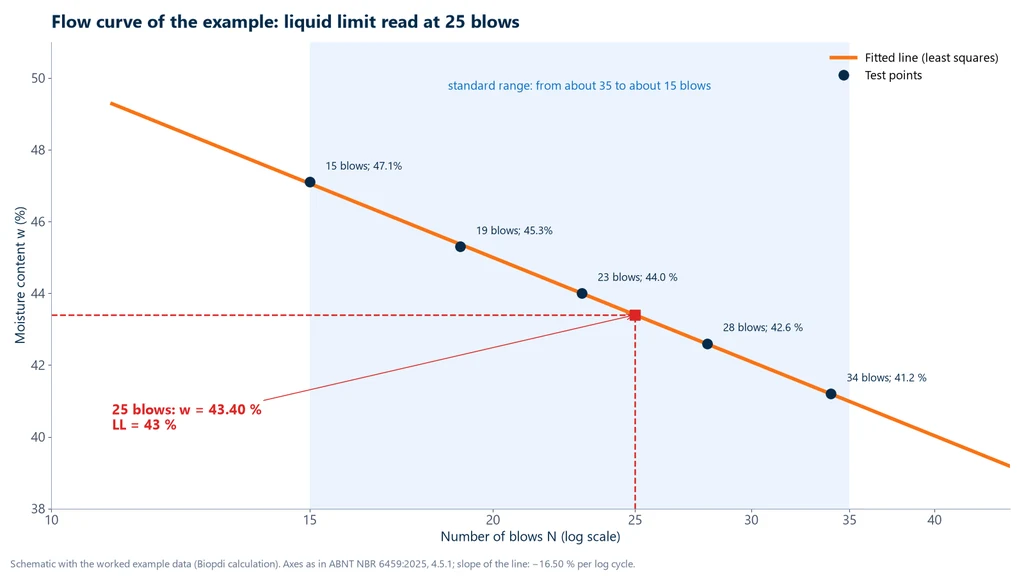
The liquid limit graph, called the flow curve, has the number of blows on the x-axis on a logarithmic scale and the moisture content on the y-axis on an arithmetic scale, as required by NBR 6459:2025. On this scale, the five points fall approximately on a straight line, which is fitted to the points. The liquid limit is the moisture content read on the line at 25 blows, rounded to the nearest whole number.
The slope of this line, the change in moisture content per log cycle of blows, is called the flow index in the literature. It shows how much the strength of the paste changes with moisture: a steep line indicates a soil whose consistency changes a lot with little water. NBR 6459:2025 does not require the flow index, but it is useful to check the test: a point far off the line usually indicates an error in moisture content or in blow counting.
A warning for those working with highway documents: DNER-ME 122/94 (the Brazilian highway agency's method) and the DNIT Pavement Manual draw the same graph with the axes swapped, with the blows on a logarithmic scale on the y-axis and the moisture content on the x-axis. The liquid limit comes out the same, because the line is the same; only the appearance of the graph changes. The mistake is mixing the two in the same report without saying which convention was followed. The graph in the worked example later in this article follows the NBR convention.
When the result is NL
Under NBR 6459:2025, when the groove cannot be cut, or when closure cannot be obtained with more than 25 blows, the sample is recorded as NL: it has no liquid limit. The second condition applies to soils that, even with the driest paste that can still be molded, close the groove with only a few blows, because the paste slides in the cup instead of flowing plastically: the 25-blow point simply does not exist for them. This is typical of fine sands and silts with little clay, which are usually also nonplastic in the PL test.
Liquid limit by formula: one-point method and fall cone
NBR 6459:2025 has no formula for the liquid limit: the result comes from the graph with at least five points. The formula that shows up in searches such as "liquid limit formula" is that of the rapid, one-point method of the Brazilian highway standard DNER-ME 122/94, and there is also a one-point method in ASTM D4318. Outside the Casagrande cup, the fall cone is the main international alternative.
One-point method of DNER-ME 122/94
The rapid method of DNER-ME 122/94 is based on the idea that the flow curves of different soils have similar slopes. So, with a single moisture content h obtained with N blows, between 20 and 30, the moisture content at 25 blows is estimated by:
LL = h × (N / 25)0.156 = h × K(N)
The factor K(N) is tabulated in the standard itself, from 0.966 for 20 blows to 1.029 for 30 blows. The standard requires two separate determinations, between 20 and 30 blows and with moisture content up to 150%; if the two LL values differ by more than 1%, the test is repeated, and the LL is the average of the two. The table shows the factors:
| Blows N | K(N) | Blows N | K(N) |
|---|---|---|---|
| 20 | 0.966 | 26 | 1.006 |
| 21 | 0.973 | 27 | 1.012 |
| 22 | 0.980 | 28 | 1.018 |
| 23 | 0.987 | 29 | 1.023 |
| 24 | 0.994 | 30 | 1.029 |
| 25 | 1.000 |
The method is fast and useful for field quality control where the same material is tested many times, but it is not NBR 6459:2025. A report that claims to follow the ABNT standard and presents a one-point LL has the wrong reference. ASTM D4318-26 also has a one-point method, method B; the standard says that if the requester does not specify, the multipoint method is used.
Fall cone
The fall cone determines the LL from the penetration of a metal cone dropped onto the paste, instead of counting blows. In the method described by the U.S. Bureau of Reclamation (report GR-84-11, 1984), the LL is the moisture content at which an 80 g, 30° cone penetrates 20 mm into the sample in about 5 seconds. ISO 17892-12:2018 includes both the cone and the Casagrande cup as LL methods.
The advantage of the cone is that it depends less on the operator. The same USBR report lists the weaknesses of the Casagrande method that motivated the alternative: low-plasticity soils that slide in the cup instead of flowing, soils that liquefy under impact, sensitivity to small differences in manufacture and wear of the apparatus, and sensitivity to the technique of whoever prepares the paste and counts the blows. In Brazil, however, NBR 6459:2025 only provides for the Casagrande apparatus, and the cone is left for research or for tests under foreign standards. The LL values from the two methods are close but not identical, and should not be mixed in the same series without stating which method was used.
Plastic limit: the 3 mm thread test (NBR 7180:2025)
The plastic limit is the moisture content at which the soil stops being moldable and starts to crumble. It is measured as the moisture content at which a soil thread, rolled by hand on a glass plate, crumbles when it reaches 3 mm in diameter. Under NBR 7180:2025 (the Brazilian standard for plastic limit determination), the PL is the average of at least three accepted determinations, expressed as a whole percentage.
What is the plastic limit of a soil
The PL is the lowest moisture content at which the soil can still be rolled into a thin thread without breaking. Above it, the thread lengthens without cracking; below it, the thread cracks and crumbles before thinning down to 3 mm. The value is not universal: it depends on the soil, which is why it has to be tested. Clean sands do not form a thread at any moisture content and are nonplastic; clays form threads easily and have a well-defined PL.
Plastic limit apparatus and step by step
The NBR 7180:2025 apparatus is the bare minimum of a soil laboratory: oven, porcelain dish, spatula, containers with lids, a balance with 200 g capacity and 0.01 g resolution, a ground-glass plate about 30 cm on each side and a cylindrical comparison rod 3 mm in diameter and about 100 mm long. The standard has no figures or tables, and the method is manual. Using the other half of the sample prepared according to NBR 6457:2024, the sequence is:
- Prepare the paste: add distilled water gradually, kneading and mixing, until you get a homogeneous paste of plastic consistency, mixing for 15 to 30 minutes.
- Form the ball: weigh about 10 g of the paste and form a small ball.
- Roll: roll the ball on the glass plate with the palm of your hand, with enough pressure to give it the shape of a thread.
- Did it break before 3 mm? The paste is too dry: return it to the dish, add water, mix for at least 3 minutes and go back to step 2.
- Did it reach 3 mm intact? The paste is too wet: knead the material, which makes it lose moisture, and roll it again.
- It crumbled at 3 mm and about 100 mm long, checked against the comparison rod: immediately transfer the pieces to a container and determine the moisture content according to NBR 6457:2024.
- Repeat until you have at least three moisture content values.
Judging the moment the thread "crumbles" is up to the operator, which is why the standard requires several determinations and an acceptance criterion. The ground-glass plate is not a detail: the rough surface draws out moisture and provides friction so the thread rolls without slipping; on a smooth plate, the thread slides and thins unevenly.
The ± 5% of the mean criterion
Under NBR 7180:2025, the moisture content values are satisfactory when at least three of them fall within ± 5% of the mean, and the PL is the average of these values, as a whole percentage. The literal reading of the text is 5% relative to the mean value, not 5 percentage points. The difference is large: with a mean of 24.9%, the accepted range is 24.9 × 0.95 = 23.66% to 24.9 × 1.05 = 26.15%, that is, ± 1.25 points, not 19.9% to 29.9%. A value of 22.8% would fall outside and would require a new determination to complete three accepted values.
When the soil is NP
If the 3 mm thread cannot be obtained, the sample is recorded as NP: it has no plastic limit. NBR 7180:2025 uses the same abbreviation for the PI: when the LL or the PL cannot be determined, the plasticity index is recorded as NP, nonplastic. In practice, the two readings converge: a soil without a PL is treated as nonplastic in any classification. The standard does not cover the rare case in which the PL comes out equal to or greater than the LL; the usual practice is to record it as nonplastic too, but this practice has no explicit basis in the text.
Plasticity index and derived indices
The plasticity index is the width of the moisture range in which a soil behaves as a plastic material. It is calculated as the difference between the liquid limit and the plastic limit. From the plasticity index and the limits, soil mechanics defines other indices that compare the natural moisture content with the limits, or the PI with the clay content.
How to calculate the plasticity index
According to NBR 7180:2025 (the Brazilian standard for the plastic limit of soils), PI = LL − PL, expressed as a percentage, with the LL determined by NBR 6459 (the Brazilian standard for the liquid limit). With LL = 43% and PL = 25%, PI = 18%. If the LL or the PL cannot be determined, the PI is reported as NP (non-plastic). The Paving Manual of DNIT (Brazil's federal highway agency) (2006, p. 35) explains why the PI is so widely used: it is highest in clays and lowest in sands, so it gives a direct measure of how clayey a soil is. The higher the PI, the more plastic the soil.
There is no single official PI scale. The cutoffs that actually decide something are in the classification systems and specifications: a PI of 10 or 11% separates groups in the HRB system, a PI between 4 and 7% is a borderline zone on the plasticity chart, and granular stabilized base courses under DNIT 141/2022-ES (the Brazilian specification for granular stabilized bases) require a PI of 6% or less. The "slightly, moderately and highly plastic" tables found in course handouts vary from source to source and do not replace these criteria.
Consistency index and liquidity index
The consistency index and the liquidity index place the natural moisture content w of the soil relative to the limits:
- Consistency index: CI = (LL − w) / PI. It equals 0 when the natural moisture content equals the LL and 1 when it equals the PL.
- Liquidity index: LI = (w − PL) / PI. It equals 0 at the PL and 1 at the LL.
The two are complementary: CI + LI = 1, always. A negative CI, or an LI greater than 1, means the soil exists in the field at a moisture content above the LL, which is the case for very soft clays, usually sensitive to remolding. A CI greater than 1 means the moisture content is below the PL, typical of stiff, desiccated clays. These indices are meaningful for saturated clays; in unsaturated soils, such as many tropical soils, the natural moisture content alone does not describe consistency, because suction also stiffens the soil.
Activity of clays (Skempton)
Activity, defined by A. W. Skempton in "The Colloidal 'Activity' of Clays" (3rd International Conference on Soil Mechanics, Zurich, 1953), is the ratio of the PI to the percentage by mass of particles finer than 2 µm: A = PI / (% < 2 µm). Skempton observed that, within a given clay layer, this ratio is approximately constant, which is why it characterizes a clay better than the PI alone. He classified clays into three groups:
| Class | Activity | Reference minerals (Skempton, 1953, Table 1) |
|---|---|---|
| Inactive | A < 0.75 | Quartz 0.0; calcite 0.18; muscovite mica 0.23; kaolinite 0.33 to 0.46 |
| Normal | 0.75 to 1.25 | Illite 0.90 |
| Active | A > 1.25 | Calcium montmorillonite 1.5; sodium montmorillonite 7.2 |
Activity helps interpret what particle size distribution and the limits say together. A clay with a lot of fine material and a moderate PI has low activity, typical of kaolinite, a common mineral in Brazilian tropical soils. A clay with little fine material and a high PI has high activity, a sign of montmorillonite, and with it comes the potential for swelling and shrinkage as moisture changes. The percentage finer than 2 µm comes from the sedimentation (hydrometer) test, explained in the article on soil particle size analysis per NBR 7181.
Worked example: from the test to soil classification
The following example goes through the complete characterization of the fine fraction of a soil, from the liquid limit to classification in the USCS and HRB systems. The data are for teaching purposes, and all calculations are our own, redone for this article. In addition to the limits, three values that would come from other tests are assumed: a natural moisture content of 32%, 52% of material passing the No. 200 sieve (0.075 mm) and 30% of particles finer than 2 µm.
Step 1: the moisture content of each LL point
Each test point produces a moisture container. At the third point, for example, the empty container weighs M3 = 14.85 g, with the wet soil M1 = 27.31 g and, after oven drying, M2 = 23.50 g. According to NBR 6457:2024 (the Brazilian standard for soil sample preparation and moisture content), w = (M1 − M2) / (M2 − M3) × 100 = 3.81 / 8.65 × 100 = 44.05%, reported as 44.0%. The wet soil mass is 27.31 − 14.85 = 12.46 g, above the 8.0 g minimum that NBR 6457:2024 requires for the LL. The five points were as follows:
| Point | Blows N | log N | w (%) |
|---|---|---|---|
| 1 | 34 | 1.531 | 41.2 |
| 2 | 28 | 1.447 | 42.6 |
| 3 | 23 | 1.362 | 44.0 |
| 4 | 19 | 1.279 | 45.3 |
| 5 | 15 | 1.176 | 47.1 |
The set meets NBR 6459:2025: five points, from the driest (34 blows) to the wettest (15 blows), with moisture content always increasing.
Step 2: the flow line and the liquid limit
Fitting a straight line to the five (log N; w) pairs by least squares, the means are log N = 1.3591 and w = 44.04%, and the slope comes out at −16.50% per log cycle. At 25 blows, log 25 = 1.3979, and the moisture content on the line is w = 44.04 − 16.50 × (1.3979 − 1.3591) = 43.40%. Rounded to the nearest whole number, as NBR 6459:2025 requires, LL = 43%. The points lie no more than 0.1 point from the line, a sign of a consistent test. The chart shows the five points, the line and the reading at 25 blows:
As a check, the one-point method of DNER-ME 122/94 (a Brazilian highway test method) applied to a determination at 22 blows with 44.3% moisture content gives LL = 44.3 × 0.980 = 43.4%, the same value as the line. The agreement occurs because the slope for this soil is close to the one assumed by the 0.156 exponent; for a soil with a very different flow curve, the one-point method departs from the multipoint method.
Step 3: the plastic limit
Three threads crumbled at 3 mm, with moisture contents of 24.1%, 25.0% and 25.6%. The mean is 74.7 / 3 = 24.9%, and the ± 5% range goes from 23.66% to 26.15%. All three values fall within it, so the result is accepted under NBR 7180:2025: PL = 25%.
Step 4: PI, CI, LI and activity
- Plasticity index: PI = 43 − 25 = 18%.
- Consistency index: CI = (43 − 32) / 18 = 0.61. The natural moisture content lies between the PL and the LL, in the plastic state.
- Liquidity index: LI = (32 − 25) / 18 = 0.39. Check: 0.61 + 0.39 = 1.00.
- Activity: A = 18 / 30 = 0.60, an inactive clay in Skempton's classification (A < 0.75), consistent with predominantly kaolinite.
Step 5: USCS classification
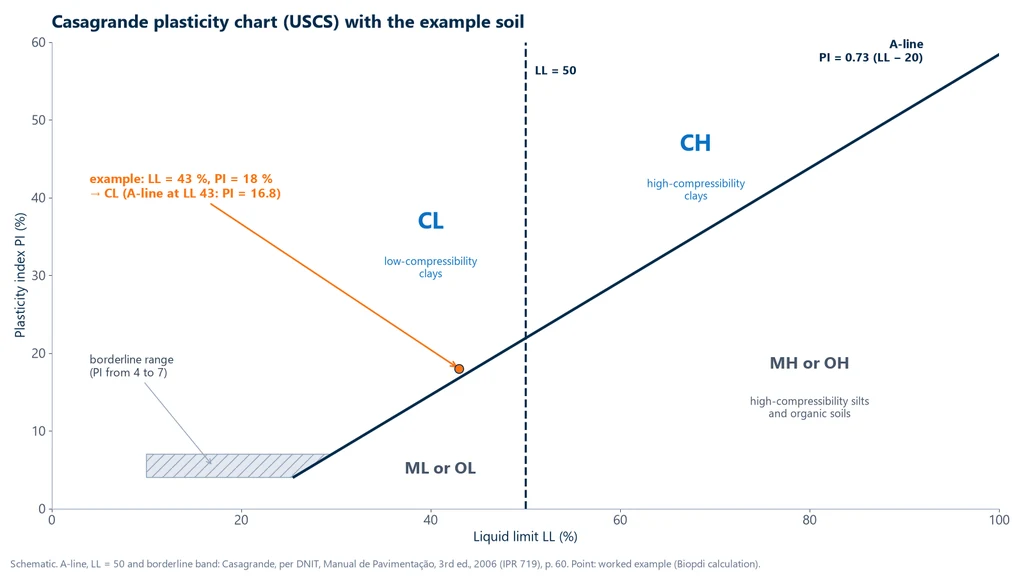
With 52% passing the No. 200 sieve, the soil has 50% or more fines and is classified as fine-grained. The A-line of the plasticity chart, at LL = 43, is at PI = 0.73 × (43 − 20) = 16.8. The soil's PI, 18, is higher, so the point lies above the A-line, in the clay region; and the LL, 43, is lower than 50, so compressibility is low. The classification is CL, inorganic clay of low to medium plasticity. The next section explains the chart and shows the point on it.
Step 6: HRB (TRB/AASHTO) classification and group index
With 52% passing the No. 200 sieve, above 35%, the soil belongs to the silt-clay materials, groups A-4 to A-7. With an LL of 41 or more and a PI of 11 or more, it is in group A-7. To separate the subgroups, the PI is compared with LL − 30 = 13: since the PI, 18, is greater than 13, the subgroup is A-7-6. The group index, using the formula from the DNIT Paving Manual (2006, p. 37), GI = 0.2a + 0.005ac + 0.01bd, uses:
- a = 52 − 35 = 17 (percentage passing the No. 200 sieve minus 35, between 0 and 40);
- b = 52 − 15 = 37 (percentage passing the No. 200 sieve minus 15, between 0 and 40);
- c = 43 − 40 = 3 (LL minus 40, between 0 and 20);
- d = 18 − 10 = 8 (PI minus 10, between 0 and 20).
GI = 0.2 × 17 + 0.005 × 17 × 3 + 0.01 × 37 × 8 = 3.40 + 0.26 + 2.96 = 6.6, which is reported as a whole number: A-7-6 (7). The result of the example, in one line: LL = 43%, PL = 25%, PI = 18%, CL in the USCS and A-7-6 (7) in the HRB, with a note that the sample was prepared with prior air drying.
Casagrande plasticity chart and soil classification
The plasticity chart is a graph with the liquid limit on the horizontal axis and the plasticity index on the vertical axis, devised by Arthur Casagrande, in which two lines divide fine-grained soils into groups: the A-line, with the equation PI = 0.73 (LL − 20), and the vertical line LL = 50. It is the chart that turns the two test results into a USCS classification.
A-line, LL = 50 and the CL, CH, ML, MH, OL and OH groups
The Paving Manual of DNIT (Brazil's federal highway agency) (2006, p. 60) describes the chart as follows: the A-line is an empirical boundary between inorganic clays (CL and CH), generally above it, and inorganic silts and soils with colloidal organic matter (ML, MH, OL and OH), generally below it. The vertical line LL = 50 separates soils with a low LL (letter L) from those with a high LL (letter H). In the lower part of the chart, with LL below 50 and PI between about 4 and 7, the properties of clays and silts overlap and the A-line becomes a band: soils that fall there are classified as borderline, with a dual symbol. The chart below shows the lines, the zones and the soil from the example:
The table summarizes how to read the USCS fine-grained soil groups:
| Symbol | Position on the chart | Description |
|---|---|---|
| CL | Above the A-line, LL ≤ 50 | Inorganic clays of low and medium plasticity |
| CH | Above the A-line, LL > 50 | Inorganic clays of high plasticity |
| ML and OL | Below the A-line, LL ≤ 50 | Inorganic silts and very fine sands; organic silts and clays of low plasticity |
| MH and OH | Below the A-line, LL > 50 | Elastic silts; organic clays of medium to high plasticity |
The distinction between inorganic (M) and organic (O) soils, which fall in the same region of the chart, does not come from the limits alone: it depends on identifying the organic matter. The chart also shows a physical relationship recorded in the DNIT Manual: among soils with the same LL, those with a higher PI are more cohesive and less permeable, and compressibility increases roughly with the LL. The reference standard for the USCS is ASTM D2487, currently in edition D2487-17(2025), active.
HRB (TRB/AASHTO) classification
The HRB highway classification, now called TRB, is the one adopted in the DNIT Paving Manual and groups soils from A-1 to A-7 by particle size distribution, limits and group index. For soils with more than 35% passing the No. 200 sieve, the limits decide the group, as shown in the table, built from the cutoffs in the DNIT Paving Manual (2006, Table 4):
| Group | LL (%) | PI (%) | Maximum GI |
|---|---|---|---|
| A-4 (silty soils) | 40 max. | 10 max. | 8 |
| A-5 (silty soils) | 41 min. | 10 max. | 12 |
| A-6 (clayey soils) | 40 max. | 11 min. | 16 |
| A-7 (clayey soils) | 41 min. | 11 min. | 20 |
Group A-7 is divided into A-7-5, when the PI is equal to or less than LL − 30, and A-7-6, when it is greater. The group index, from 0 to 20, combines the fine fraction, the LL and the PI into a number that ranks the soil's performance as subgrade: the higher, the worse. The manual rates silt-clay materials, as a group, as fair to poor for subgrade. The classification depends on the percentage passing the No. 200 sieve, which comes from particle size analysis: the procedure is in the article on soil particle size analysis.
Tropical soils and the MCT methodology
The USCS and HRB systems were developed with temperate-climate soils. In tropical soils, especially lateritic ones, the limits and particle size distribution do not always predict behavior: a lateritic soil may have an LL and PI that would classify it as poor and yet, once compacted, perform well in a pavement layer. The DNIT Paving Manual (2006, p. 56) cites the MCT classification, developed by Nogami and Villibor, which describes the lateritic or saprolitic behavior of soils. It does not replace the limits in soil characterization, but it exists because the limits have this limitation. The same care applies to sample preparation: in tropical soils, air drying the sample can change the limits, which is why both standards require reporting whether prior drying was used.
Reference values: when the LL and PI are high
The liquid and plastic limits of a soil have no typical value that makes testing unnecessary: they depend on the amount and type of clay, and soils with the same name can have very different limits from one borrow pit to another. Tables of values by soil type circulate in course handouts without a verifiable original source and are useful, at most, to check whether a result is plausible. What can be used with confidence are the cutoffs set by standards and classification systems:
| Cutoff | What it decides | Source |
|---|---|---|
| LL = 50% | Low (L) or high (H) compressibility in the USCS | Casagrande chart (DNIT Manual, 2006) |
| LL 40/41% and PI 10/11% | Groups A-4, A-5, A-6 and A-7 in the HRB | DNIT Manual, 2006, Table 4 |
| PI between 4 and 7% below LL 50 | Clay/silt borderline band, dual symbol | DNIT Manual, 2006, p. 60 |
| LL ≤ 25% and PI ≤ 6% | Granular stabilized base material | DNIT 141/2022-ES |
| Activity 0.75 and 1.25 | Inactive, normal or active clay | Skempton (1953) |
For granular stabilized bases, DNIT 141/2022-ES (the Brazilian highway specification for this base course) accepts LL and PI above these limits when the sand equivalent exceeds 30, as detailed in the CBR test article. The logic common to all these cutoffs is the same: the more plastic the fine fraction, the more sensitive the material is to water and the more it deforms, which is acceptable in an embankment and unacceptable in a pavement base.
What Atterberg limits are used for on site
Atterberg limits are used to classify a soil, to predict its behavior before more expensive tests are run, and to accept or reject construction materials. They are bench tests, performed without a loading machine, so they almost always come first in soil characterization; the mechanical tests come later and build on what the limits have already shown.
Classification and material selection
Together with the particle size distribution, the LL and the PI give the USCS (Unified Soil Classification System) and HRB (AASHTO) classifications, which are the first screening of borrow pits and fill materials. An A-7-6 soil with a high GI (group index), like the one in the example, will rarely go into a pavement layer without treatment, but it may be suitable for the body of an embankment. For pavement layers, the specification sets the limits directly, such as LL ≤ 25% and PI ≤ 6% for the base course.
Compaction and CBR
The limits also help predict behavior during compaction: more plastic soils tend to have a higher optimum moisture content and flatter compaction curves, and they are more sensitive on the wet side. Compaction itself is determined by the Proctor test, explained in the article on soil compaction and the Proctor test. The compacted specimen then goes to the CBR test, the California Bearing Ratio: the test that measures, as a percentage, the resistance of the compacted soil to the penetration of a piston compared with a standard crushed stone, after four days of soaking. The complete procedure is in the article on the CBR test.
Compressibility and strength of clays
In foundation clays, the LL is used in compressibility correlations for preliminary design, such as the Terzaghi and Peck correlation for the compression index of normally consolidated clays, discussed in the article on the consolidation test; the correlation does not replace the oedometer test. The liquidity index shows whether the natural clay is close to the liquid state, which guides sampling and strength testing. Shear strength is measured in the triaxial test and in the direct shear test, which receive specimens of soils already characterized by the limits. In soils with high activity, the limits warn of swelling, which must be measured before the structure is founded on them.
The equipment after the limits
The Casagrande apparatus, the grooving tool, the glass plate, the gauge rod, the balance and the oven are bench instruments that Biopdi does not manufacture. Biopdi manufactures the equipment for the mechanical tests that follow characterization: the CBR/Marshall test press, which performs the CBR penetration on the compacted specimen, the consolidation press, the direct shear press and the triaxial presses. The complete line is at soil testing equipment.
Common mistakes with Atterberg limits
Most discrepancies between Atterberg limit reports come from outdated references and execution details, not from the calculation. The mistakes below are the ones that appear most often in reports, course notes and technical web pages:
- Citing NBR 6459:2016 or NBR 7180:2016 as current. Both Brazilian standards (for the liquid limit and the plastic limit, respectively) were canceled and replaced by the editions of 09/18/2025.
- Saying the PI is in NBR 6459. The LL is in NBR 6459:2025; the PL and the PI calculation are in NBR 7180:2025.
- Writing that the groove closes over "1 cm" or "12 mm". NBR 6459:2025 specifies about 13 mm; the "1 cm" comes from DNER-ME 122/94.
- Starting the paste at about 15 blows and drying between points. NBR 6459:2025 starts near 35 blows and keeps adding water, from dry to wet, until it reaches about 15.
- Placing the paste and cutting the groove with the cup mounted on the apparatus. Both operations are performed with the cup in the operator's hand.
- Swapping the graph axes without stating the standard. NBR puts the blows on a log scale on the x-axis; DNER-ME 122/94 puts them on the y-axis.
- Presenting a one-point LL as if it were NBR 6459. The formula with the 0.156 exponent belongs to the rapid method of DNER-ME 122/94; NBR requires the graph with at least five points.
- Reading the ±5% of the PL as 5 percentage points. It is 5% of the mean: with a mean of 25%, the range is about ±1.25 points.
- Requiring five PL repetitions "by the standard". NBR 7180:2025 calls for at least three accepted values.
- Writing "PI + CI = 1". The correct relationship is CI + LI = 1.
- Thinking the PI separates low and high plasticity in the USCS. What separates L and H is LL = 50; the PI places the soil relative to the A-line.
- Omitting the prior drying in the report. Both standards require stating whether the sample was air-dried, because in tropical soils this changes the result.
- Using a worn cup or a base that has not passed the ball check. The LL depends on the blow energy; a soft base or a scratched cup shifts the result without the operator noticing.
Conclusion
Atterberg limits summarize in two numbers how the fine fraction of a soil reacts to water. Under NBR 6459:2025, the LL comes from at least five points in the Casagrande apparatus, from dry to wet, read at 25 blows on a semi-logarithmic straight line; under NBR 7180:2025, the PL is the mean of at least three moisture contents at which the thread crumbles at 3 mm, within ±5% of the mean; and the PI is the difference between the two. Together with the particle size distribution, these numbers classify the soil on the plasticity chart and in the HRB system and anticipate what the mechanical tests will measure.
The next steps of characterization have their own articles: sample preparation and moisture content, particle size distribution, Proctor compaction and the CBR test. To choose the equipment for the mechanical soil tests in your laboratory, talk to one of our specialists.
Other tests and technical references
CBR test and the California Bearing Ratio
CBR test (California Bearing Ratio): NBR 9895:2025 and DNIT 172 standards, procedure, formula with 6.9 and 10.35 MPa, worked example and CBR by layer.
Direct shear test: ASTM D3080 standard, step-by-step procedure and how to calculate c' and φ'
The direct shear test measures soil shear strength and gives the cohesion c' and friction angle φ'. ASTM D3080-23, step by step, with a worked example.
Soil compaction and the Proctor test per ABNT NBR 7182:2025
Soil compaction on site and the Proctor test per NBR 7182:2025: compaction energies, worked curve example, optimum moisture content and degree of compaction.
Soil particle size analysis: sieve and hydrometer test and gradation curve per NBR 7181
Soil particle size analysis per NBR 7181:2025: sieving, hydrometer sedimentation, gradation curve, D10, Cu and Cc, NBR 6502 fractions, worked example.
Frequently asked questions
How is the liquid limit calculated?
Under NBR 6459:2025 (the Brazilian liquid limit standard), at least five pairs of blow count and moisture content are obtained in the Casagrande apparatus, from about 35 to about 15 blows, and the moisture content is plotted against the number of blows on a logarithmic scale. A straight line is drawn through the points, and the LL is the moisture content read at 25 blows, rounded to the nearest whole number. In the example in this article, the line gives 43.40% at 25 blows, and the LL is 43%.
Is there a formula for the liquid limit?
NBR 6459:2025 has no formula: the LL comes from the graph. The rapid method of DNER-ME 122/94 uses LL = h × (N/25)0.156, with N between 20 and 30 blows, two determinations that may not differ by more than 1%, and the LL equal to the mean. ASTM D4318-26 also has a one-point method, method B.
How is the liquid limit graph drawn?
Under NBR 6459:2025, the number of blows goes on the x-axis, on a logarithmic scale, and the moisture content on the y-axis, on an arithmetic scale; the points are fitted with a straight line, and the LL is the ordinate at 25 blows. DNER-ME 122/94 uses swapped axes, with the same result.
What is the plastic limit of a soil?
It is the lowest moisture content at which the soil can still be rolled into a 3 mm diameter thread without crumbling; under NBR 7180:2025, it is the mean of at least three accepted moisture contents, within ±5% of the mean, as a whole percentage. The value varies from soil to soil and must be determined by testing.
Which standard covers the plastic limit test?
It is ABNT NBR 7180:2025, 3rd edition, of 09/18/2025 (the Brazilian plastic limit standard), which canceled the 2016 edition and also includes the plasticity index calculation. In highway projects in Brazil, DNER-ME 082/94 is still found, and in the United States the PL is in ASTM D4318-26.
How is the plasticity index calculated?
The plasticity index is PI = LL − PL, as a percentage, under NBR 7180:2025. A soil with an LL of 43% and a PL of 25% has a PI of 18%. If the LL or the PL cannot be determined, the PI is reported as NP, non-plastic.
What do NL and NP mean?
NL means the soil has no liquid limit: under NBR 6459:2025, it was not possible to cut the groove or to obtain closure with more than 25 blows. NP means the soil has no plastic limit, because it does not form the 3 mm thread, and it is also how the PI is reported when the LL or the PL is missing.
What is the Casagrande plasticity chart?
It is the graph of PI versus LL that classifies fine-grained soils in the USCS, with the A-line, PI = 0.73 (LL − 20), and the vertical line LL = 50. Above the A-line are the inorganic clays (CL and CH); below it, the silts and organic soils (ML, MH, OL and OH); to the left of LL = 50, those of low compressibility.
What is the activity of a clay?
It is the plasticity index divided by the percentage of particles smaller than 2 µm, defined by Skempton in 1953. Below 0.75 the clay is inactive, like kaolinite (0.33 to 0.46); between 0.75 and 1.25 it is normal; above 1.25 it is active, like sodium montmorillonite (7.2), with swelling potential.
What is the difference between the Casagrande apparatus and the fall cone?
With the Casagrande apparatus, the LL is the moisture content at which the groove closes with 25 blows; with the fall cone, it is the moisture content at which an 80 g, 30° cone penetrates 20 mm, a method described by the U.S. Bureau of Reclamation and included in ISO 17892-12:2018. The cone depends less on the operator, but in Brazil NBR 6459:2025 provides only for the Casagrande method.
What does the CBR value of a soil mean?
The CBR, or California Bearing Ratio, is the resistance of the compacted soil to the penetration of a piston, as a percentage of the resistance of a standard crushed stone, measured after four days of soaking. It evaluates the soil as a pavement layer and is explained in the article on the CBR test.